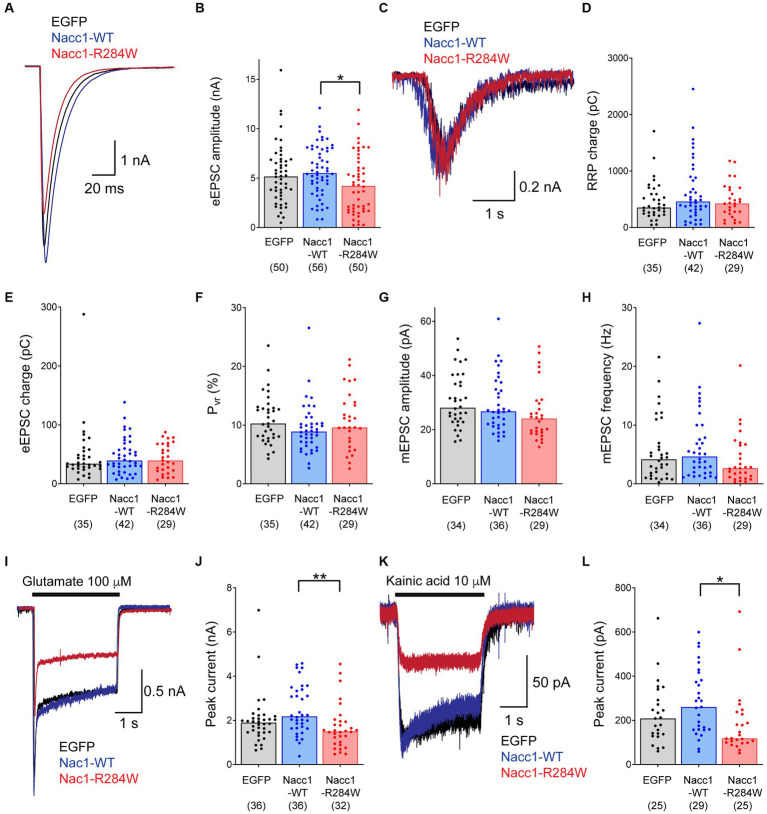
Figure 1.
Expression of Nacc1-R284W decreases EPSC amplitude compared to Nacc1-WT in Nacc1+/− glutamatergic neurons. Autaptic glutamatergic hippocampal neurons from Nacc1+/− mice were transduced with lentivirus inducing expression of either EGFP (black), Nacc1-WT (blue), or Nacc1-R284W (red). Synaptic function was then examined using patch clamp recording. (A) Overlaid representative eEPSC traces taken from a single cell from each transduction condition. (B) Bar charts showing the eEPSC amplitudes measured from single autaptic neurons transduced as above. (C) Representative overlaid traces of the current evoked by the application of 500 mM sucrose to evoke fusion of synaptic vesicles (SVs) in the RRP. (D) Bar charts showing the average total charge transferred by the release of the RRP in individual neurons transduced as above. (E) Bar charts showing the charge transferred by the eEPSC in individual neurons. (F) Bar charts showing the probability of vesicular release (Pvr) of individual neurons transduced as above. Pvr was calculated by dividing the charge transfer during an evoked EPSC by the charge transfer during the sucrose response, and then expressed as a percentage. (G) Bar charts showing the amplitude of spontaneous miniature EPSCs (mEPSCs) recorded from individual transduced neurons in the presence of 300 nM TTX. (H) Bar charts showing the frequency (Hz) of mEPSCs recorded from individual transduced neurons. (I) Overlaid representative traces of the current induced by perfusion with 100 μM glutamate. (J) Bar charts showing the amplitude of the peak current generated by glutamate application in transduced neurons. (K) Overlaid representative traces of the current induced by perfusion with 10 μM kainic acid (KA). (L) Bar charts showing the amplitude of the peak current generated by KA application in transduced neurons. In each chart, dots represent values recorded for individual cells, while the bar height represents the median of all cells. The number of cells analyzed for each condition is displayed beneath the condition label on each charts. Data were compared using a Kruskal-Wallis test by ranks followed by Dunn’s multiple comparisons test. * Denotes a p value of between 0.01 and 0.05, ** denotes a p value of between 0.001 and 0.01.

