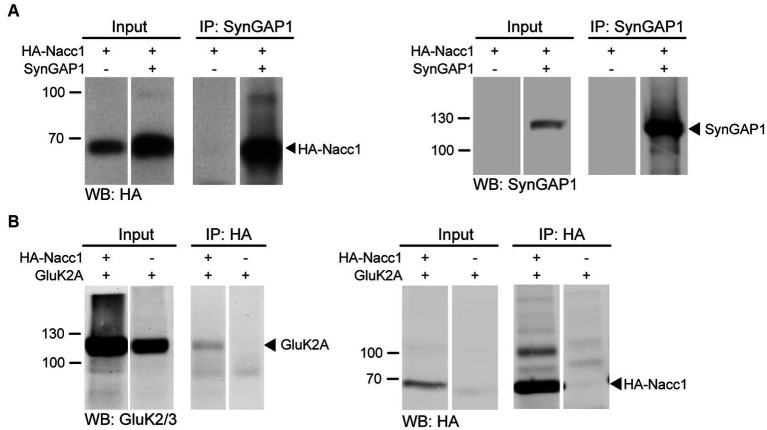
Figure 2.
Nacc1 interacts with the synaptic proteins SynGAP1 and GluK2A. (A) Anti-HA (left panel) and anti-SynGAP1 (right panel) Western blot analysis of input and eluate fractions from an anti-SynGAP1 affinity purification (IP: anti-SynGAP1) in N2A cells expressing SynGAP1 and HA-Nacc1 alone or in combination. Black arrowheads indicate unmodified HA-Nacc1 (left) or SynGAP1 (right). (B) Anti-GluK2A/3 (left panel) and anti-HA (right panel) Western blot analysis of input and eluate fractions from an anti-HA affinity purification (IP: anti-HA) in N2A cells expressing GluK2A and HA-Nacc1 alone or in combination. A black arrowhead indicates GluK2A in the left blot. On the right, a black arrowhead indicates unmodified HA-Nacc1. Molecular weight markers (kDa) are indicated to the left of the blots. Individual lanes of single Western blot membranes are shown in A and B, since several lanes contained samples not relevant to the figure. The full blots are available in Supplementary Figure S8. Images are representative of at least 3 independent experiments.

