Figure 3.
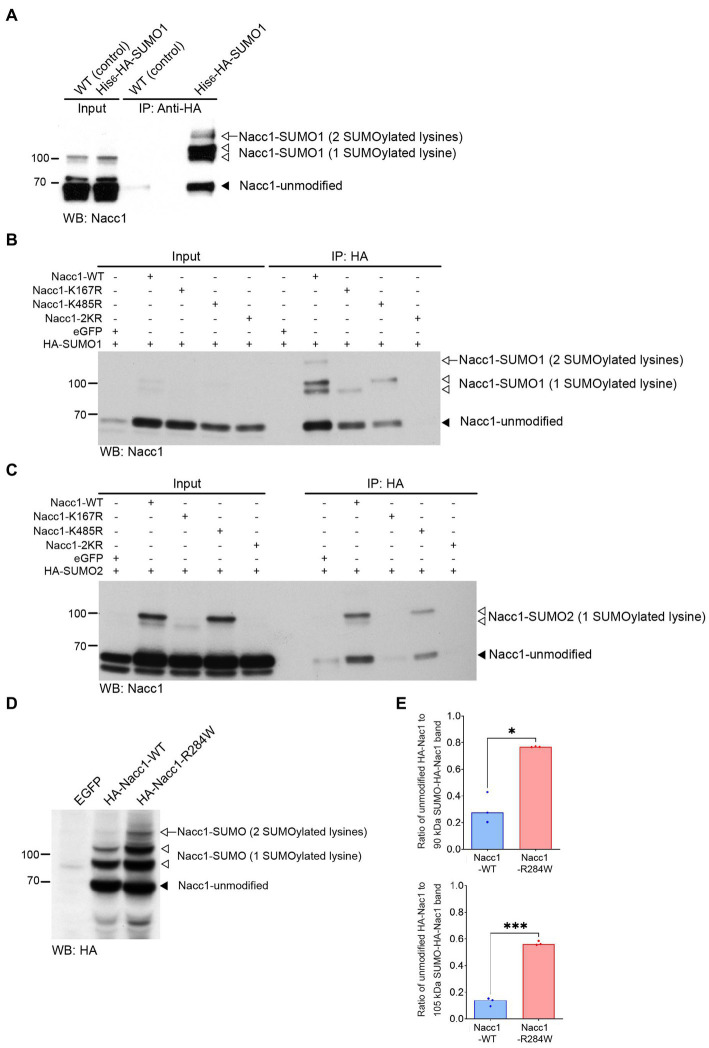
Nacc1 is conjugated to SUMO in vivo and in vitro and Nacc1-R284W exhibits increased SUMO conjugation in neurons. (A) Western blot analysis using anti-Nacc1 antibody of input and HA peptide eluate fractions from an anti-HA affinity purification (IP: anti-HA) of WT (WT) and His6-HA-SUMO1 knock-in (KI) mouse brain. The black arrowhead indicates the position of non-modified Nacc1, the white arrowhead indicates Nacc1 modified with one SUMO1 peptide (appearing as doublet), and the white arrow indicate Nacc1 modified with two SUMO1 peptides. (B) Anti-Nacc1 Western blot analysis of input and eluate fractions from an anti-HA affinity purification (IP: anti-HA) in N2A cells expressing HA-SUMO1 plus either EGFP, Nacc1-WT, Nacc1-K167R, Nacc1-K485R, or Nacc1-2KR. The black arrowhead indicates unmodified Nacc1, the white arrowheads indicate Nacc1 conjugated to a single SUMO1 peptide (appearing as a doublet), and the white arrow indicates Nacc1 conjugated to two SUMO1 peptides. (C) Anti-Nacc1 Western blot analysis of input and affinity purification eluate fractions (IP: anti-HA) of N2A cells expressing HA-SUMO2 plus either EGFP, Nacc1-WT, Nacc1-K167R, Nacc1-K485R, or Nacc1-2KR. The black arrowhead indicates unmodified Nacc1 and the white arrowheads indicate Nacc1 conjugated to a single SUMO2 peptide (appearing as a doublet). Molecular weight markers (kDa) are indicated to the left of the blots. (D) Anti-HA Western blot analysis of lysate from primary hippocampal neuron infected with lentivirus mediating expression of EGFP, HA-Nacc1-WT, or HA-Nacc1-R284W. The black arrowhead indicates non-modified Nacc1, the white arrowheads indicate Nacc1 modified with one SUMO peptide, and the white arrow indicates Nacc1 modified with two SUMO peptides. (E) Bar charts showing a quantification of the ratio of unmodified Nacc1 to the SUMO-Nacc1 band at 90 kDa (upper chart), or to the SUMO-Nacc1 band at 105 kDa (lower chart). Data were normalized to the total protein loading for each well. Data were compared using a Welch t-test. * Denotes a p value of between 0.01 and 0.05, *** denotes a p value of between 0.0001 and 0.001. Images are representative of at least 3 independent experiments. Corresponding anti-HA blots for the experiments shown in (B) and (C) are presented in Supplementary Figure S9. Molecular weights in kDa are indicated next to all blots.

