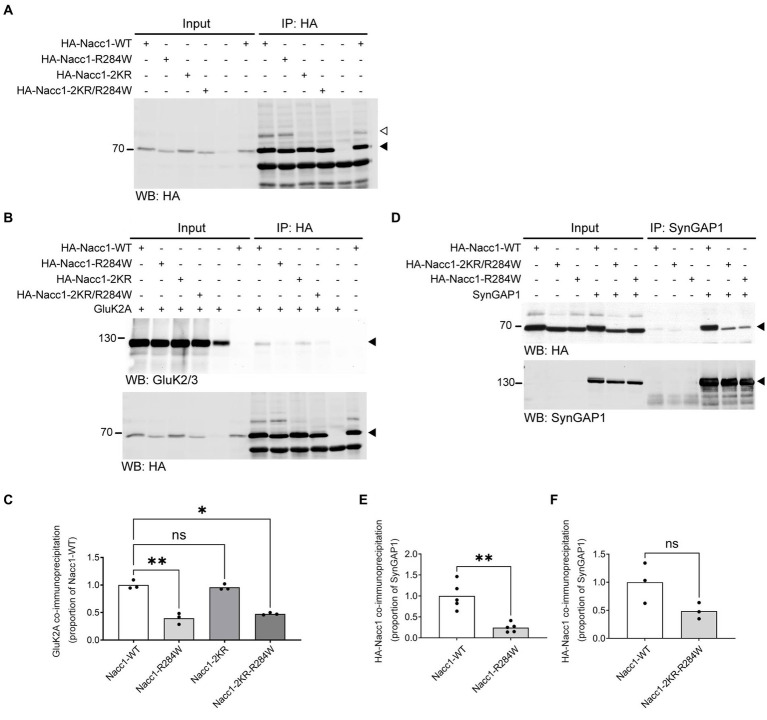
Figure 4.
Nacc1-R284W exhibits impaired binding to SynGAP1 and GluK2A. (A) Representative anti-HA Western blot analysis of input and eluate fractions from an anti-HA affinity purification (IP: anti-HA) in N2A cells expressing one of four HA-Nacc1 constructs, as indicated above the blot. Black arrowhead indicates unmodified Nacc1, white arrowhead indicates Nacc1 conjugated to a SUMO protein. (B) Anti-GluK2A (top) and anti-HA (bottom) Western blot analysis of input and eluate fractions from an anti-HA affinity purification (IP: anti-HA) in N2A cells expressing GluK2A alone or in combination with one of four HA-Nacc1 constructs as indicated on top of the blot/images. A black arrowhead indicates GluK2A (top panel) or non-SUMO modified Nacc1 (bottom panel). (C) Bar charts showing quantification of the amount of GluK2A enriched after anti-HA-Nacc1 affinity purification using the various HA-Nacc1 mutants. The amount of GluK2A present in the eluate sample after anti-HA affinity purification was normalized firstly to the amount of GluK2A in the corresponding input sample, then to the amount of HA-Nacc1 enriched in the corresponding sample after affinity purification, and then finally expressed as a proportion of the amount of enrichment observed in the HA-Nacc1-WT sample. Data were compared using a Brown-Forsythe ANOVA followed by a Dunnett’s T3 multiple comparisons test. * Denotes a p value of between 0.01 and 0.05, ** denotes a p value of between 0.001 and 0.01. In each chart, dots represent values for a biological replicate and the bar height represents the median of all cells. N = 3 independent experiments. (D) Anti-HA (top panel) and anti-SynGAP1 (bottom panel) Western blot analysis of input and eluate fractions from an anti-SynGAP1 affinity purification (IP: anti-SynGAP1) of N2A cells expressing SynGAP1 alone or in combination with the various Nacc1 constructs as indicated on top of the blot. A black arrowhead indicates unmodified Nacc1 (top panel) or SynGAP1 (bottom panel). (E) Bar chart showing quantification of the amount of HA-Nacc1-R284W enriched by anti-SynGAP1 affinity purification, compared to HA-Nacc1-WT. The amount of each HA-Nacc1 construct present in the eluate sample after anti-SynGAP1 affinity purification was normalized firstly to the amount of HA-Nacc1 in the corresponding input sample, then to the amount of SynGAP1 enriched in the corresponding sample after affinity purification, and then finally expressed as a proportion of the amount of enrichment observed in the HA-Nacc1-WT sample. In each chart, dots represent values for a biological replicate and the bar height represents the median of all cells. Data were compared using a Welch’s t-test. ** Denotes a p value of between 0.001 and 0.01. N = 5 independent experiments. (F) Bar chart showing quantification of the amount of Nacc1-R284W-2KR enriched by anti-SynGAP1 affinity purification, compared to Nacc1-WT. Data normalization was performed as described for (E). In each chart, dots represent values for a biological replicate and the bar height represents the median of all cells. NS denotes no significant difference. N = 3 independent experiments. Molecular weights in kDa are indicated next to all blots.

