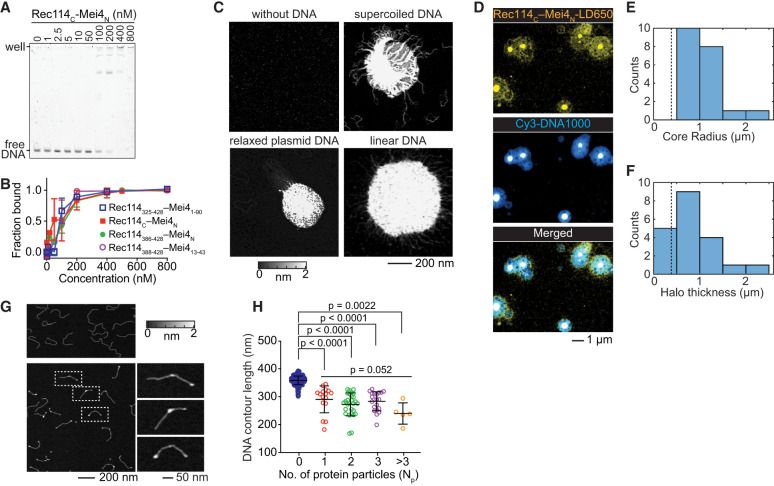
Figure 4.
DNA binding and nucleoprotein condensate formation by the RM-TDB domain. (A) Representative EMSA of binding to a 150-bp DNA substrate. (B) Comparison of DNA binding (150-bp substrate) by RM-TDB complexes composed of different fragments of Rec114 and Mei4. Error bars indicate mean ± range (two replicate experiments) or mean ± SD (three replicates). C50 values were 90 nM ± 20 nM for Rec114N–Mei41–90 (mean ± range), 90 nM ± 30 nM for Rec114C–Mei4N (mean ± SD), and 110 nM ± 30 nM for Rec114386–428–Mei4N (mean ± range). The EMSA for Rec114388–428–Mei413–43 was conducted once (C50 of ∼100 nM). (C) AFM images of 200 nM Rec114C–Mei4N in the absence of DNA or presence of 1 ng/µL supercoiled pUC19 plasmid DNA, relaxed circular pHOT1 plasmid DNA, or 1000-bp linear DNA. (D) Confocal images of condensates formed by 450 nM fluorescently labeled (LD650) Rec114C–Mei4N and 25 nM 1000-bp Cy3 DNA. (E,F) Quantification of the radius of central cores (E) and thickness of haloes (F) of the condensates from confocal images (N = 20). Dashed lines indicate the expected contour length of free DNA (0.383 µm). (G) AFM images of 1 ng/µL 1000-bp linear DNA in the absence (top) or presence (bottom) of 70 nM Rec114C–Mei4N. Examples of DNA molecules with bound protein (dashed boxes) are shown in zoomed insets at the right. (H) DNA contour lengths of free DNA (blue points) and protein-bound DNA (with Np indicating the number of protein particles per DNA molecule). Error bars indicate mean ± SD. Free DNA, 358 nm ± 16 nm (N = 474 DNA molecules); Np = 1 particle bound, 290 nm ± 48 nm (N = 16 DNA molecules); Np = 2 particles bound, 272 nm ± 41 nm (N = 28 DNA molecules); Np = 3 particles bound, 283 nm ± 34 nm (N = 21 DNA molecules); Np > 3 particles bound, 240 nm ± 38 nm (N = 5 DNA molecules). The pairwise P-values are from unpaired two-tailed Student's t-tests. The group P-value for different numbers of protein particles bound is from a Kruskal–Wallis test.

