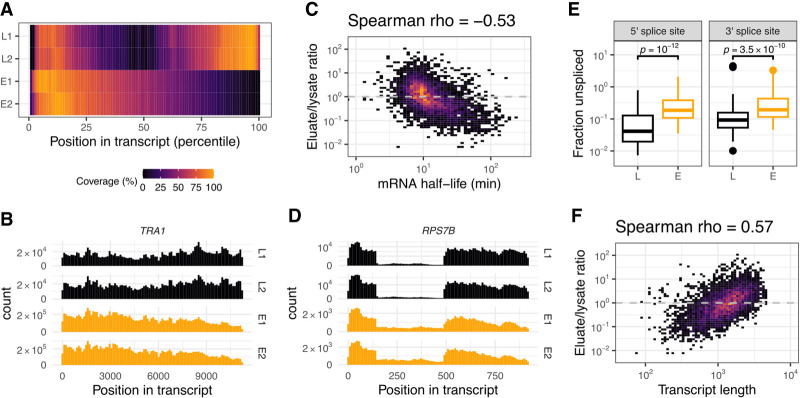
Figure 2.
RNA content characterization of purified mRNPs. (A) Metagene coverage analysis of transcripts for both RNA-seq replicates, each originating from total lysate (L1 and L2) or natively eluted particles (E1 and E2). Sequence coverage for each annotated yeast transcript open reading frame (nuclear genome-encoded and non-intron-containing) was split into 100 bins and scaled linearly between 0 and 1. Average per bin was further scaled linearly between 0% and 100%. (B) Coverage histogram example for a transcript derived from the TRA1 locus. Samples are as in A; histograms have 100 bins. (C) Transcript enrichment in eluate over lysate versus previously published mRNA half-lives (Sun et al. 2013). Spearman correlation coefficient is indicated at the top. (D) Coverage histogram as in B for a transcript originating from the monointronic gene RPS7B. (E) Distribution of the unspliced fraction per transcript for annotated splice sites in the lysate (L) and eluate (E) samples. The fraction of unspliced reads was calculated as the ratio of nonsplit read versus split read counts for reads that overlapped with the annotated splice site (junctions covered with <20 reads were excluded). P-values were calculated using the Wilcoxon rank-sum test. (F) Transcript enrichment in eluate over lysate versus annotated transcript length for the same subset of transcripts as in C.

