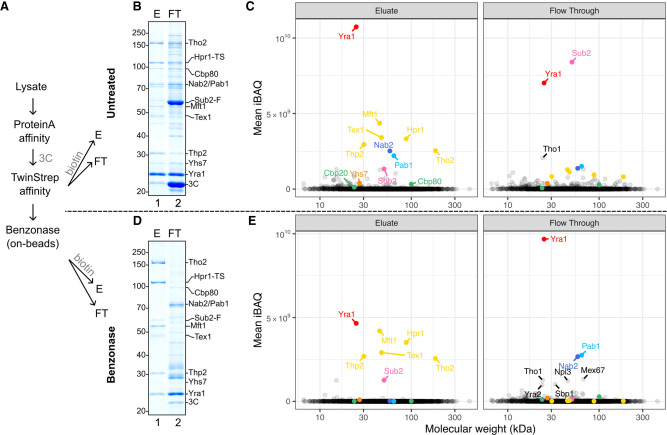
Figure 3.
Protein content characterization of purified mRNPs. (A) Schematic of sample preparation procedure for quantitative proteomics mass spectrometry analysis from the hpr1-TS/Sub2-FLAG-3C-ProtA yeast strain (where Sub2 and Hpr1 served as bait proteins in the affinity purification). Four samples for each condition were prepared by TCA precipitation of native eluates (E) or flowthrough (FT). One sample was used for SDS-PAGE control, and three were used for mass spectrometry analysis. (B) Coomassie-stained 10% SDS-PAGE gels of TCA-precipitated native eluate (E) or unbound fractions (FT) from the second affinity step. (C) Mean intensity-based absolute quantitation (iBAQ) values from three replicates in each condition from B. Each point represents one identified protein positioned horizontally according to its theoretical molecular weight. THO complex components are in yellow, cap binding components are in shades of green, tail binding components are in shades of blue, Sub2 is in pink, Yra1 is in red, Yhs7 is in orange, and additional mRNP-associated proteins are annotated in black. (D) Coomassie-stained 10% SDS-PAGE gels of TCA-precipitated native eluate (E) or released fraction (FT) after on-bead benzonase treatment prior to elution from the second affinity step. (E) Mean iBAQ values from three replicates in each condition from D. Color scheme is the same as in C.

