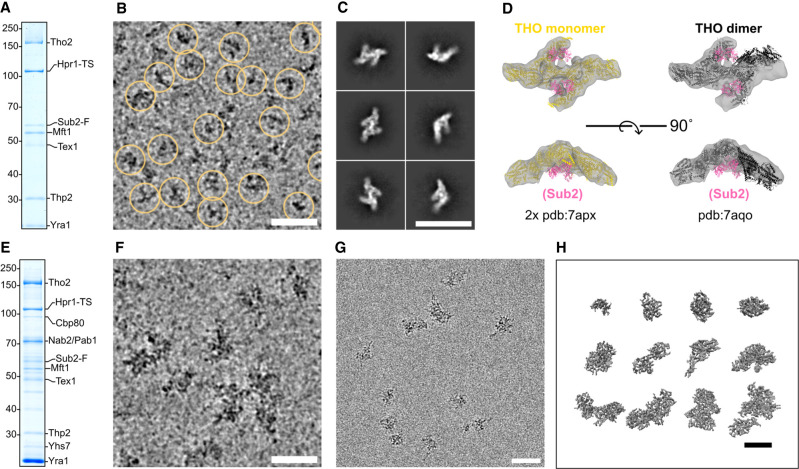
Figure 4.
Morphology of isolated nuclear mRNPs by cryo-EM and cryo-ET. (A) Coomassie-stained 10% SDS-PAGE gel of a TCA-precipitated aliquot from the benzonase-treated native eluate that was used to prepare the grids in B. (B) Cryo-electron micrograph crop-out of benzonase-treated particles on a 2-nm carbon-supported grid. Yellow circles indicate picked particles used in the final 3D reconstructions. Acquired at 3-µm defocus. Scale bars in this and all other panels, 500 Å. (C) Cryo-EM single-particle analysis. Selected 2D class averages of particles picked from the same specimen as in B are shown. (D) 3D reconstruction after classification and nonuniform refinement (most populated class out of three) displayed as a gray volume. (Left) Two monomers from a previously published structure (Schuller et al. 2020) of recombinant THO–Sub2 are separately fitted in each arm of the volume. THO is yellow, and Sub2 is pink. (Right) The dimeric form of THO–Sub2 as observed in the same published structure (THO dimer in black). (E) Coomassie-stained 10% SDS-PAGE gel of a TCA-precipitated aliquot from the native eluate that was used to prepare the grids in F. (F) Cryo-electron micrograph crop-out of native particles on a 2-nm carbon-supported grid. Acquired with a defocus of 3 µm. (G) Cryo-electron micrograph crop-out of native particles in free ice. Acquired at 3-µm defocus. (H) Selected isolated particles extracted from a reconstructed tomogram after denoising. Acquired at 5-µm defocus.

