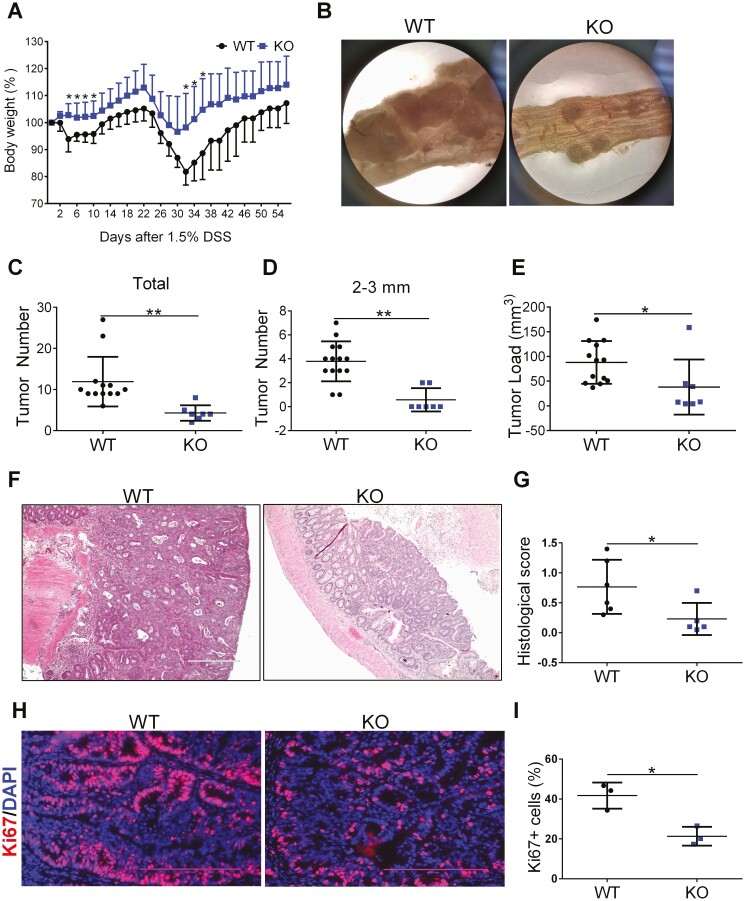
Figure 5.
Myeloid cell-specific FTH1 knockout mice show reduced colitis-associated colon tumor. A, Body weight curve and (B) macroscopy tumor image of WT and KO mice treated with AOM/DSS. Number of total colonic tumors (C) or colonic tumor with its size between 2 mm and 3 mm (D) and total tumor load (E) in WT and KO mice. F, H&E staining (Bar = 400 μm), (G) histological scoring, (H) Ki67 staining (Bar = 200 μm), and (I) quantification of colon tissues of WT and KO mice. *P < 0.05, **P < 0.01, Unpaired Student t test.

