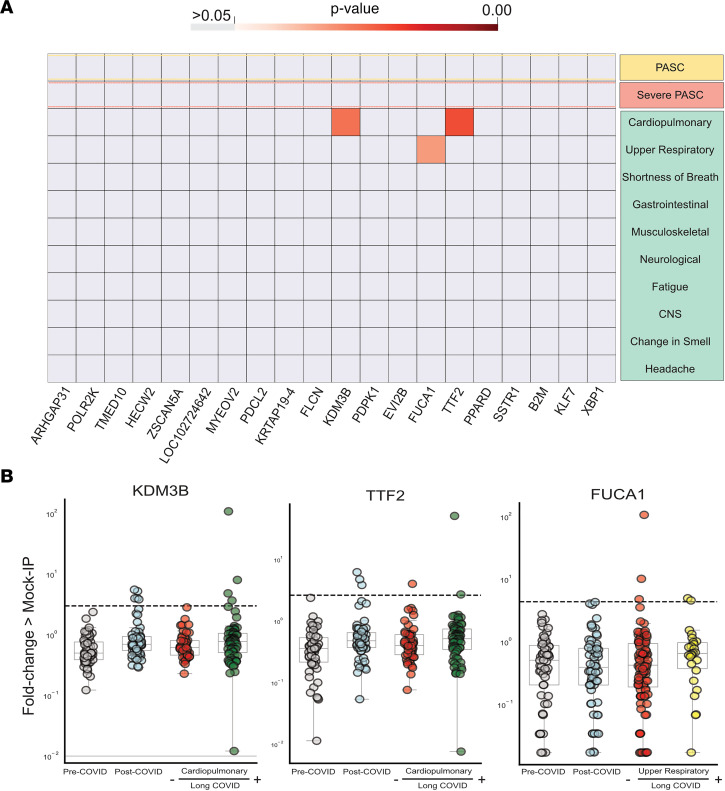
Figure 4. Few significantly increased autoreactivities in long COVID symptom phenotypes.
(A) Heatmap with P values (Kolmogorov-Smirnov testing) of differences in autoantigen enrichment for all individuals with prior COVID infection with and without additional clinical factors. Top row compares those with and without long COVID (long COVID n = 121, prior COVID without long COVID n = 64). Lower rows show subcategories of long COVID. (B) Strip plots showing the 3 autoantibodies with statistically significant enrichment in a post-COVID clinical phenotype (pre-COVID n = 57, post-COVID n = 64, cardiopulmonary long COVID n = 70, upper respiratory long COVID n = 26). Dotted lines show 6 standard deviations above the mean of pre-COVID signal (underlying box plots showing median, upper and lower quartiles, and whiskers representing 1.5 times the upper and lower interquartile range).

