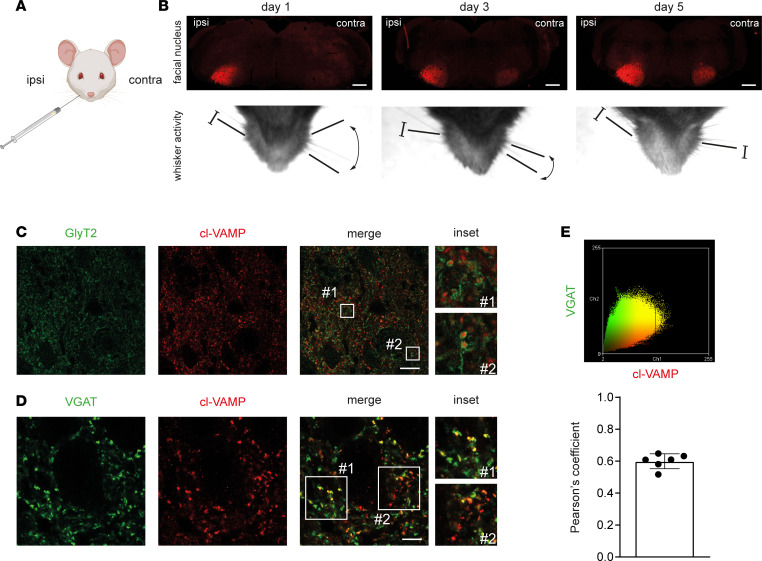
Figure 4. TeNT activity in the brainstem after injection in the WP is found at the level of inhibitory axon terminals.
(A) Cartoon showing TeNT injection (1 ng/kg in a final volume of 1 μL) in the WP. (B) TeNT activity causes the appearance and progressive accumulation of cl-VAMP (red) in the facial nucleus (FN), which acts as a reporter to illuminate the brainstem areas reached by the toxin. As soon as 1 day after injection, the ipsilateral FN displays a strong signal of cl-VAMP (upper panels), which increases over time, though the mice still have flaccid paralysis (bottom panels). From day 3, a faint signal appears also in the contralateral side, when the noninjected WP starts to be spastic, and becomes clearly stained at day 5, when the spasticity of the noninjected WP is fully attained; scale bars, 500 μm. (C) The signal of cl-VAMP (red) is surrounded by the staining of GlyT2 (green), the plasma membrane transporter involved in the reuptake of glycine in the synaptic cleft, indicating that TeNT mainly acts within the presynaptic cytoplasm of inhibitory interneurons; scale bar, 25 μm. The insets show a 10× original magnification. (D) The signal of cl-VAMP (red) appears as puncta and colocalizes with the vesicular transporter of GABA and glycine (VGAT, green), indicating that TeNT activity occurs specifically at the level of synaptic vesicles within inhibitory axon terminals; scale bar, 10 μm. The insets show a 3× original magnification. (E) Pearson’s colocalization analysis between cl-VAMP (red) and VGAT (green) signals shown as a scatterplot (top panel) and as a histogram of the correlation coefficient (bottom panel). Black circles indicate the number of brainstem slices used for the analysis.

