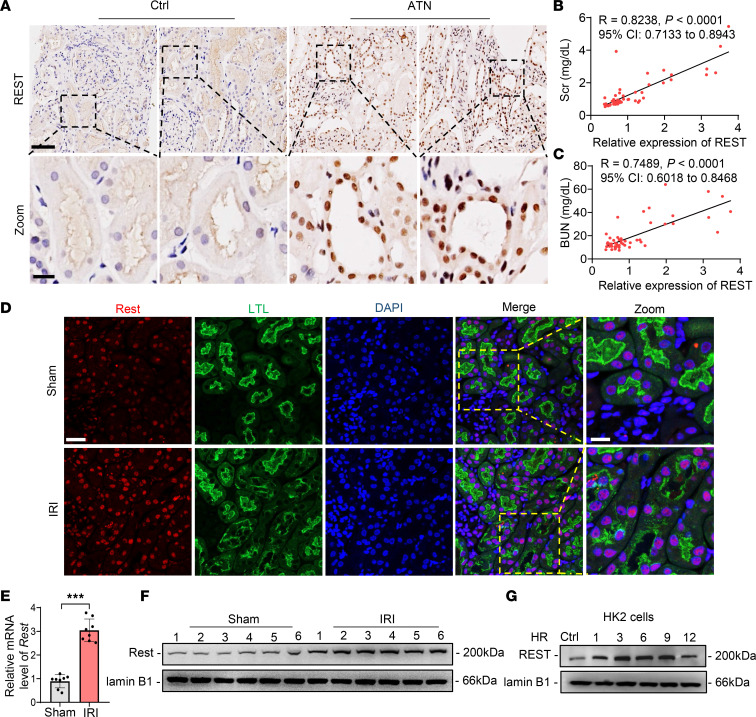
Figure 1. REST is upregulated in AKI both in vitro and in vivo.
(A) Representative immunohistochemical staining of REST in ATN patients (n = 20) or control (n = 34). Scale bar: 100 μm (top); 25 μm (down). (B and C) Correlation analysis between REST and Scr (B) or BUN (C). (D–F) Immunofluorescence (D), qPCR (E), and Western blot (F) analyses of REST in kidney tissues of sham and IRI-induced AKI mice. Scale bar: 50 μm (left); 25 μm (right). LTL, Lotus tetragonolobus lectin. (G) Western blot analysis of REST in HK2 cells under HR condition (n = 3). Data are shown as mean ± SD and were analyzed by Pearson’s correlation analysis (B and C) or 2-tailed, unpaired Student’s t test (E). ***P < 0.001.

