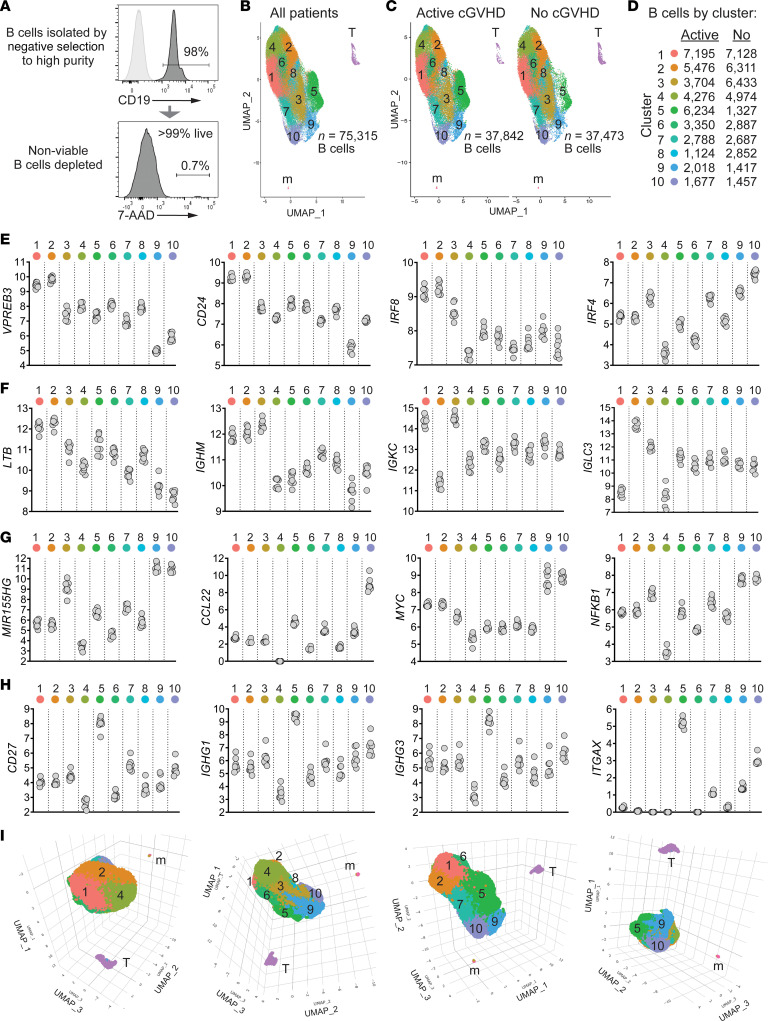
Figure 1. Unsupervised clustering analysis of scRNA-Seq data reveals multiple B cell subsets characterized by signature genes in allo-HCT patients.
(A) Representative flow cytometry histograms showing B cell purity and viability from an allo-HCT patient; 10,000 high-quality B cells per patient sample isolated in the same manner were targeted for 10x Genomics single-cell library construction (n = 4 no cGVHD, n = 4 active cGVHD). (B) Two-dimensional uniform manifold approximation and projection (UMAP) expression profiles of all untreated cells from the 8 allo-HCT patients. Numbers indicate each of the 10 major clusters identified as B cells, which were distinct spatially from residual cells identified as T cells (T) and monocytes (m). As indicated, 75,315 high-quality B cells were analyzed. (C) UMAP as in B, with B cells partitioned by patient group. Total high-quality B cells per group are indicated. (D) Number of B cells mapping to each of the 10 B cell clusters by patient group. (E–H) Log2-normalized expression of genes indicative of B cell maturity (E and F), along with activation, antibody production potential, and memory markers (G and H), by B cell cluster. Each symbol (gray circle) represents regularized log-transformed gene counts (95) (y axes) from 1 of the 8 allo-HCT patients. (I) 3D UMAPs of B cells from all patients viewed at different angles of rotation.

