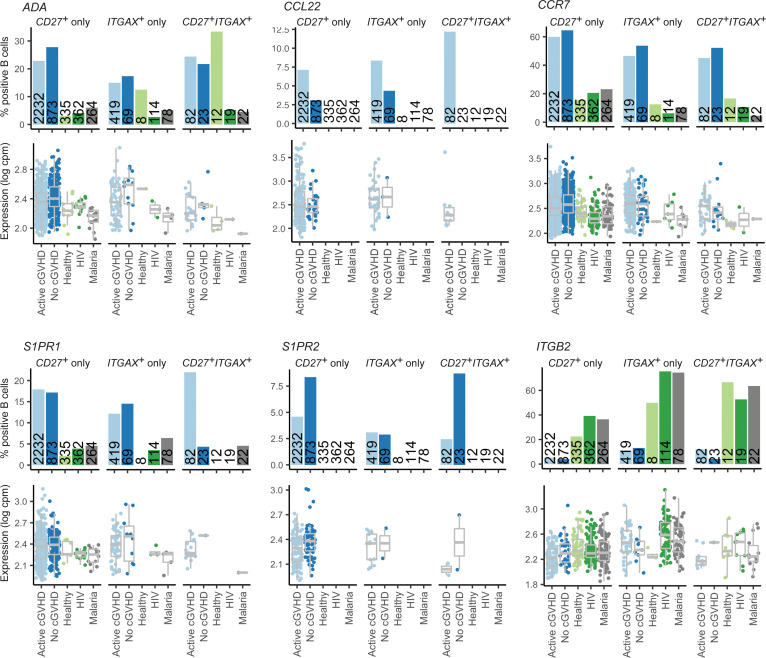
Figure 3. CD27 and ITGAX memory B cell subsets from allo-HCT patients are altered in tolerance and homing genes compared with HDs and non-HCT patients with chronic infections.
Shown are results for 6 memory B cell genes of interest displaying differences in the proportion of positive B cells between allo-HCT patients compared with HD (healthy) and non-HCT patient groups (HIV, malaria). Bar graphs represent the percentage of positive B cells for the population indicated. Numbers embedded within the bars indicate the total number of B cells identified within the subset indicated for the patient or HD group. In the gene expression graphs below each bar graph, each point represents an individual B cell, with the data normalized to show expression values for the gene of interest per million total mapped reads in the same B cell, expressed on a log scale (log counts per million). Box plots show the interquartile range (box), median (line), and minimum and maximum (whiskers).

