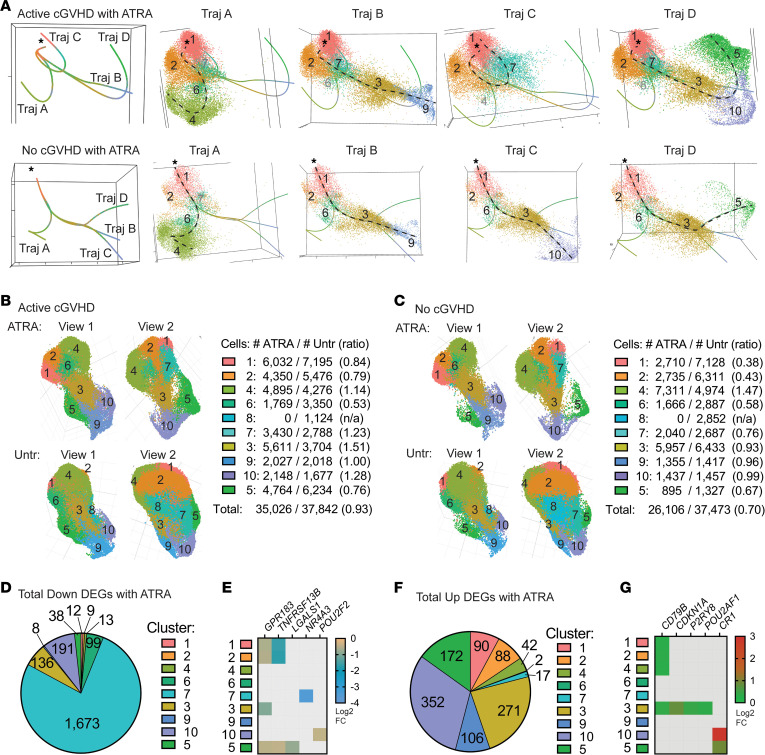
Figure 8. An inducer of cell differentiation, ATRA, differentially influences B cell pseudotime trajectories and cluster distribution in active cGVHD.
(A) Panels at left show trajectory estimates (Traj A–D) for B cells from patients with active cGVHD (top) and no cGVHD (bottom) after ATRA treatment. The origin (asterisks) was set as cluster 1, as described in Figure 7E. Panels at right for each patient group represent each trajectory in isolation (dashed line for reference), along with all its associated B cells (colored and numbered by the cluster to which they belong, as in Figure 7E). Black numbers indicate major clusters that lie along each trajectory, while clusters present but having a small number of B cells are indicated in gray. (B and C) ATRA effects on B cell distribution among clusters relative to untreated B cells. UMAP cluster projection and cell distribution per cluster among ATRA-treated and untreated (Untr) active cGVHD samples (B) and no cGVHD samples (C). Total B cell numbers within each cluster for each treatment group and patient group are indicated. For ATRA-treated B cells, the 9 clusters shown were identified as corresponding to the same 9 clusters in the untreated groups based on signature gene profiles. Ratios represent the number of B cells with ATRA treatment divided by untreated cells (ATRA/Untr). (D–G) DEGs induced by ATRA in B cells from all 8 allo-HCT patients in the scRNA-Seq data set, compared with untreated B cells from all 8 patients. Pie charts indicate the total number of DEGs significantly decreased (D) or increased (F) after ATRA treatment in the cluster indicated. Heatmaps (E and G) represent some key DEGs observed in untreated B cells alone (active vs. no cGVHD, Figure 7, C and D), that were also altered by ATRA treatment. Colored squares represent significant (Padj < 0.05) log2 FC value for the gene and cluster indicated, for ATRA-treated B cells (all 8 allo-HCT patient samples) compared with untreated B cells (all 8 allo-HCT patient samples).

