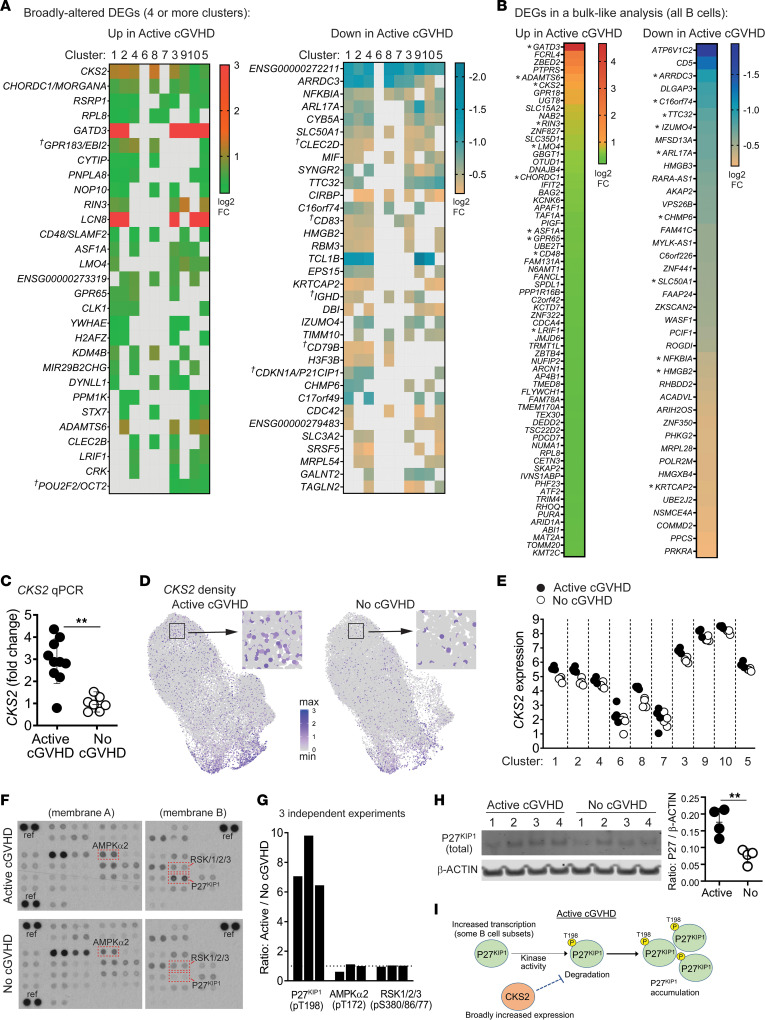
Figure 9. Assessment of DEGs occurring across many clusters provides additional insight into altered B cell functions in active cGVHD.
(A) scRNA-Seq DEGs (Padj < 0.05) occurring in 4 or more B cell clusters, either up or down in active cGVHD. Colored squares indicate significance. Crosses indicate DEGs also depicted in Figure 7, C and D. (B) scRNA-Seq DEGs (Padj < 0.05) in total untreated B cells, up or down in active cGVHD. Asterisks indicate genes also represented in A. (C) qPCR analysis of CKS2 on B cells from patients with active cGVHD (n = 10) or no cGVHD (n = 7). Results indicate fold-change CKS2 expression with the mean value in no cGVHD normalized to 1. ACTB was the housekeeping gene. Statistical comparison: 2-tailed Mann-Whitney test (GraphPad Prism 9; **, P < 0.01; error bars, mean ± SD). (D) CKS2 UMAP transcript density plots between active cGVHD and no cGVHD. Representative regions (boxes) are enlarged to visualize single B cells. (E) Representative phosphoprotein arrays on whole-cell lysates of untreated B cells from active cGVHD (n = 3) and no cGVHD (n = 3) patients. Boxes and protein IDs indicate the location (duplicate spots) of P27KIP1 (phospho-T198), AMPKα2 (phospho-T172), and RSK1/2/3 (phospho-S380/S386/S377, respectively). Reference control spots are indicated as “ref.” (G) Combined results from 3 independent phosphoprotein arrays shown in F and Supplemental Figure 7. Each bar indicates results from 1 experiment, representing average dual spot intensity for active cGVHD over no cGVHD B cells (dashed line = ratio of 1 as a guide). (H) Western blot of total P27KIP1 relative to β-ACTIN in blood B cell lysates from patients with active cGVHD (n = 4) and no cGVHD (n = 4). Statistical comparison: 2-tailed, unpaired t test (GraphPad Prism 9 software; **, P < 0.01; error bars represent mean ± SD). (I) Model depicting heightened P27KIP1 accumulation in active cGVHD B cells.

