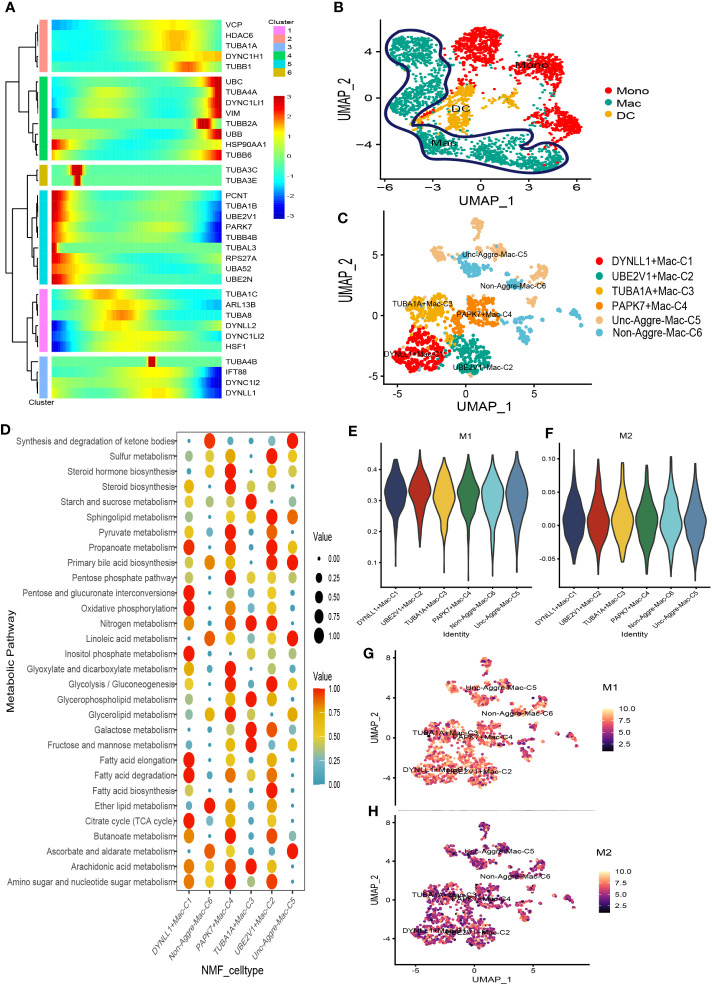
Figure 4.
Pseudotime analysis for aggrephagy-mediated Myeloid cells. (A) Pseudotime analysis reveals the role of aggrephagy-related genes for Myeloid cells (3167 cells). (B) Three subgroups of Myeloid cells were obtained by re-clustering annotation based on UMAP analysis. (C) The UMAP view and clustering analysis identifying six aggrephagy-related Mac clusters. (D) Bubble map showing significantly different activity of metabolic signaling pathway among the six aggrephagy-related Mac clusters. (E) The score of the six aggrephagy-related Mac clusters in M1 type macrophages. (F) The score of the six aggrephagy-related Mac clusters in M2 type macrophages. (G) UMAP plots of the six aggrephagy-related Mac clusters in M1 type macrophages. (H) UMAP plots of the six aggrephagy-related Mac clusters in M2 type macrophages.

