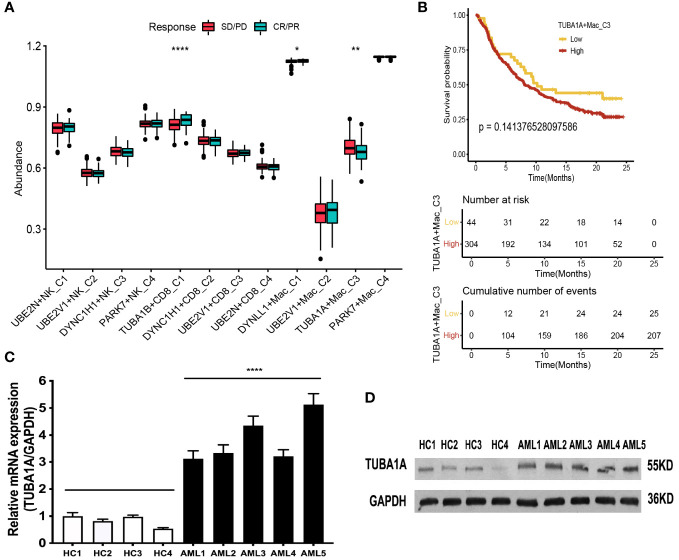
Figure 7.
Immunotherapy analysis of the aggrephagy-related cell clusters for AML based on public dataset. (A) Comparison for the response status of immune checkpoint blockade therapy for patients with AML among the aggrephagy-related cell clusters. (B) Kaplan-Meier curve for TUBA1A+Mac-C3. (C) The TUBA1A mRNA expression is upregulated in bone marrow cells of AML patient. The levels of TUBA1A mRNA and GAPDH mRNA as control in bone marrow cells of five AML patients and four health people by real-time PCR. Data are expressed as mean ± SD. (**** P <0.0001). (D) The TUBA1A protein expression is upregulated in bone marrow cells of AML patient. The levels of TUBA1A protein in bone marrow cells of five AML patients and four health people as control by Western-blot. *P < 0.05; **P < 0.01; ****P < 0.0001.

