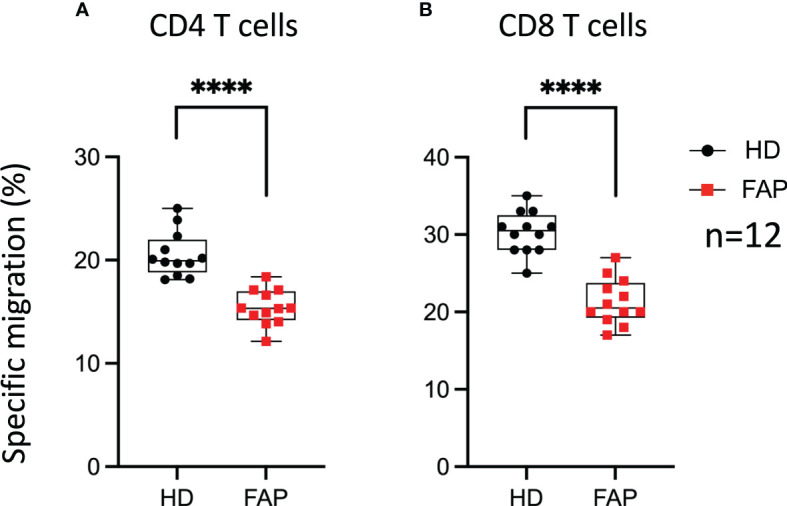
Figure 11.

T cell migration in response to chemokine. PBMC from FAP or healthy subjects were activated with TransAct™ and IL-2. Five days post stimulation, T cells were placed in the upper chamber of transwell migration filters (3 µm pore size) and let to migrate towards CXCL12 (5 ng/ml) containing medium in the lower chamber for 90 min. The percentage of input and migrated CD4+ and CD8+ T cells was assessed by FACS. (A, B) Round black dots correspond to healthy subject and red, square dots correspond to FAP subjects. Whiskers represent minimum and maximum values, whereas black and red boxes represent the second and third quartiles framing the median. Significance was determined by Mann-Whitney paired t-test. n = number of pairs. The p values: ****p < 0.0001.
