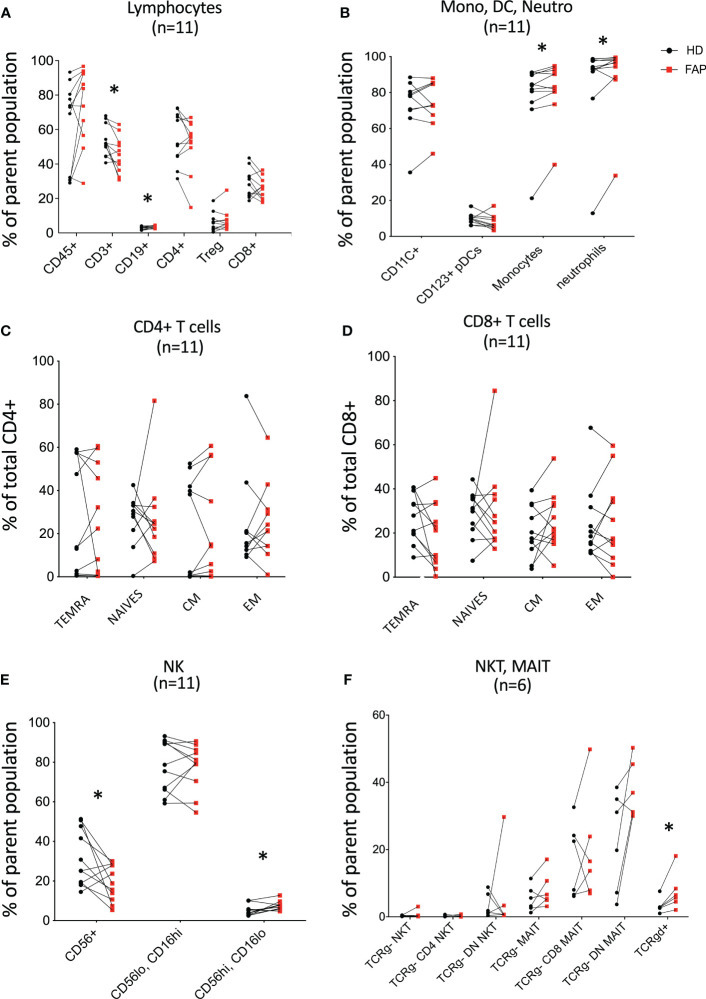
Figure 3.
Whole blood immunophenotyping by multiparameter flow cytometry. Whole blood was prepared, and immune cells were stained with directly coupled fluorescent antibodies as detailed in materials and methods and in Supplementary Table 1 . Cells were analyzed by multiparameter flow cytometry, following the gating strategies described in Supplementary Figures 1 , 2 . Cell surface molecules defining cell populations are depicted in Supplementary Figures 1 , 2 that include: (A) lymphocytes. (B) monocytes (Mono), dendritic cells (DC), neutrophils (Neutro). (C, D) CD4 and CD8 T cell subsets. (E, F) NK, NKT, MAIT, Tγδ cells. Each pair of sex and age matched FAP and healthy subject is linked by a line. Each dot represents a subject. Red square and black round symbols correspond to FAP and healthy subjects, respectively. Percentage of cells expressing the characteristic markers is plotted. Significance was determined by the Wilcoxon rank test. N = number of pairs. The p values are represented as follows: *p < 0.05, non-significant, p ≥ 0.05.

