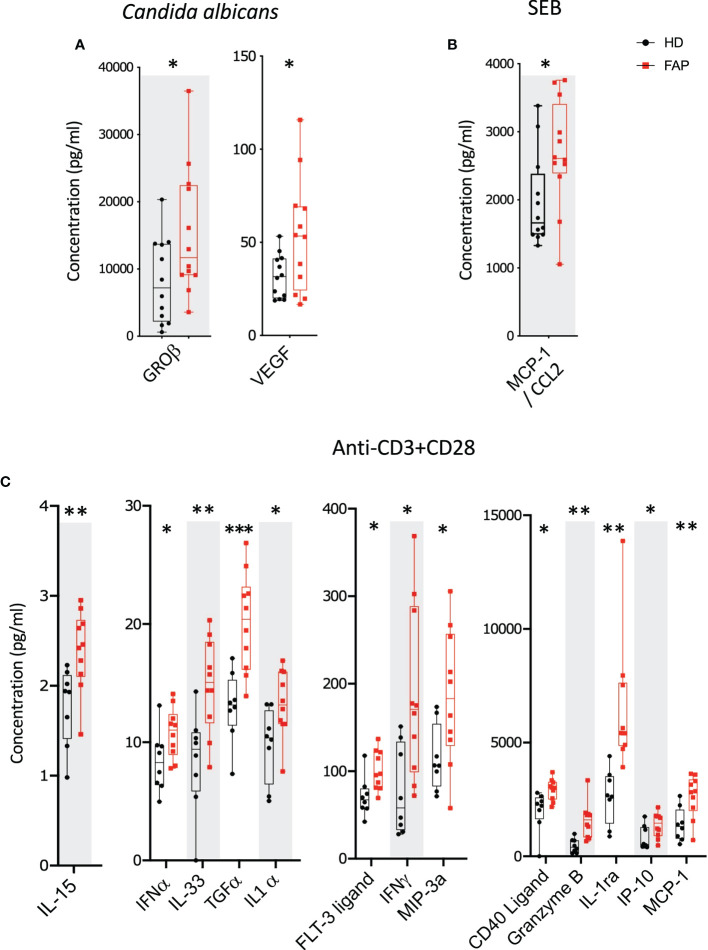
Figure 6.
Whole blood secreted proteins after stimulation. Whole blood from pairs of sex and age matched FAP and healthy subjects (one pair per incubation) was added to TruCulture tubes with no stimulus, Candida albicans, SEB, or anti-CD3+anti-CD28 stimuli and incubated during 22 hours at 37°C. Cells and supernatants were then separated. Supernatants were kept frozen. All 12 pairs of FAP and healthy subjects were then analyzed together by Luminex technology using a panel of 44 analytes ( Supplementary Table 3 ). (A) Candida albicans stimulation. (B) SEB stimulation. (C) Anti-CD3+anti-CD28 stimulation. Data were analyzed using Qlucore software. Only pairs displaying significant differences (p<0.05) are represented. No significant differences were observed in non-stimulated cells that secreted very low levels of these proteins. Black round dots correspond to healthy subjects and red square dots correspond to FAP subjects. Whiskers represent minimum and maximum values, whereas boxes represent second and third quartiles framing the median. Each dot represents one subject. n = number of pairs. The p values (t-test) are represented as follows: ***p < 0.001, **p < 0.01, *p < 0.05. Data from non-responders to anti-CD3+anti-CD28 were not included in the analysis.

