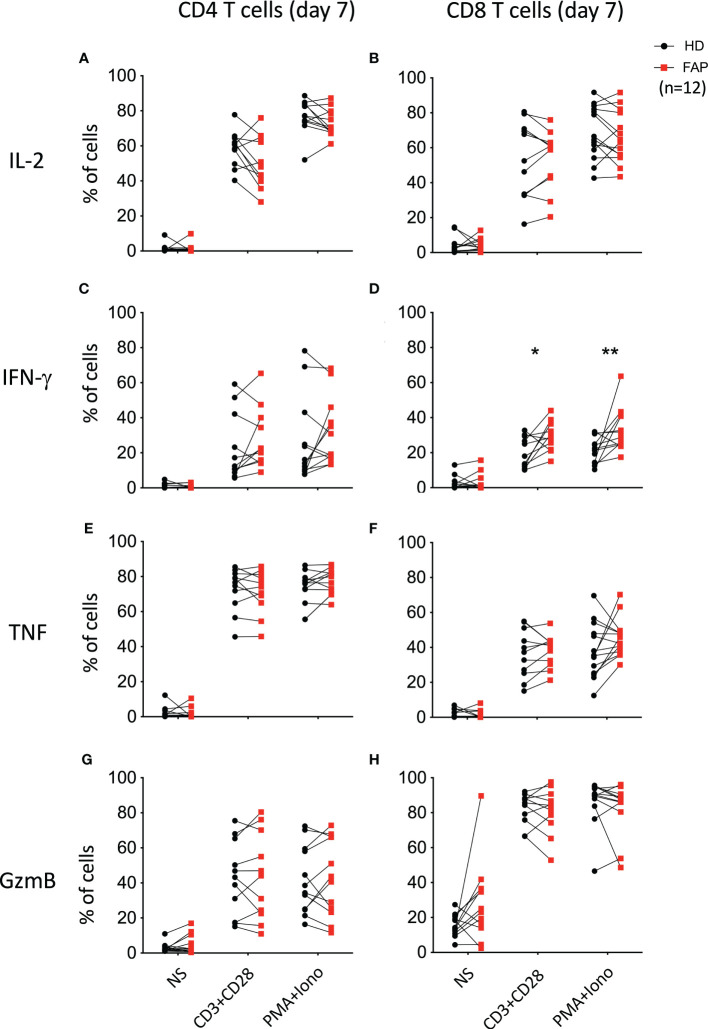
Figure 7.
Cytokine production by in vitro expanded peripheral blood T cells. T cells were expanded in vitro for 7 days by activation with anti-CD3+CD28 and cultured with IL-2. At day 7, cells were washed and restimulated for 6 h with anti-CD3+CD28 or with PMA+ionomycin. CD4+ and CD8+ T cells expressing IL-2, IFN-γ and TNF were monitored by intracellular cytokine staining and flow cytometry. In parallel, granzyme B expression was monitored. Plots show the percentage of CD4+ and CD8+ T cells expressing IL-2 (A, B), IFN-γ (C, D), TNF (E, F) and granzyme-B (GzmB; G, H). Pairs of sex and age matched FAP and healthy subjects are shown linked by a line. Each dot represents a subject. Round black dots correspond to healthy subject and red, square dots correspond to FAP subjects. n = number of pairs. Significance was determined by the Wilcoxon rank test. The p values are represented as follows: **p < 0.01, *p < 0.05.

