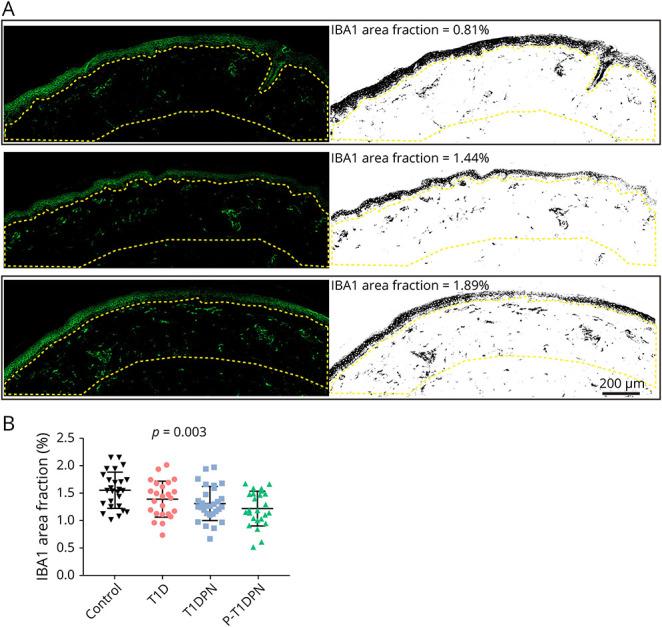
Figure 1. Immunofluorescent Labeling and Quantification of IBA1+ Macrophages in Human Skin Sections.

(A) Representative images of different expression levels of IBA1+ macrophages in skin sections. (B) The quantification of IBA1 area fraction in dermis. Enclosed area by yellow dotted line: the region of interest (dermis that was 300 μm below epidermis-dermis border); T1D = type 1 diabetes without diabetic polyneuropathy; T1DPN = type 1 diabetes with painless diabetic polyneuropathy; P-T1DPN = type 1 diabetes with painful diabetic polyneuropathy.
