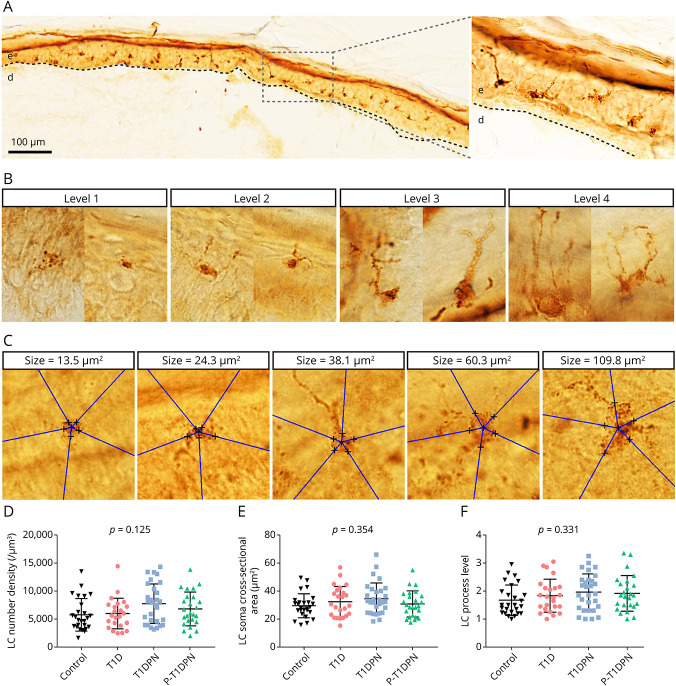
Figure 2. Quantification of Cutaneous Langerhans Cell Morphologies.
(A) Representative image of Langerhans cells in healthy human epidermis. (B) Representative structures of 4 Langerhans cell process levels. (C) Representative images of Langerhans cell soma cross-sectional area estimation. (D) The quantification of Langerhans cell number density in epidermis. (E) The quantification of Langerhans cell soma cross-sectional area in epidermis. (F) The quantification of Langerhans cell process levels in epidermis. LC = Langerhans cell; T1D = type 1 diabetes without diabetic polyneuropathy; T1DPN = type 1 diabetes with painless diabetic polyneuropathy; P-T1DPN = type 1 diabetes with painful diabetic polyneuropathy.

