. 2023 Aug 1;12:e84988. doi: 10.7554/eLife.84988

Figure 6. Benzoxazinoid soil conditioning increases wheat yield without compromising grain quality.

(A) Yield of two wheat varieties growing in soils previously conditioned with wild type (WT) or benzoxazinoid-deficient bx1 mutant maize. Kernel quality measures included (B) thousand kernel weight, (C) kernel protein content, (D) Zeleny index (flour quality), (E) dough stability, and (F) PCA of kernel micronutrient composition. For (A–E) means ±SE, boxplots, and individual datapoints are shown (n=10). ANOVA tables and pairwise comparisons within each wheat variety (FDR-corrected p values) are included. (F) reports the first two axes of the micronutrient PCA, including individual samples and the contribution of the 10 elements explaining most of the variation in the dataset (arrow length denotes relative contribution). Cond: soil conditioning (WT or bx1). Var: wheat variety. ‘C x V’: interaction between conditioning and wheat variety. Pos: position on the field. Note that the minimum values of the y-axes were set to a value greater than zero for clearer visualization of treatment differences.

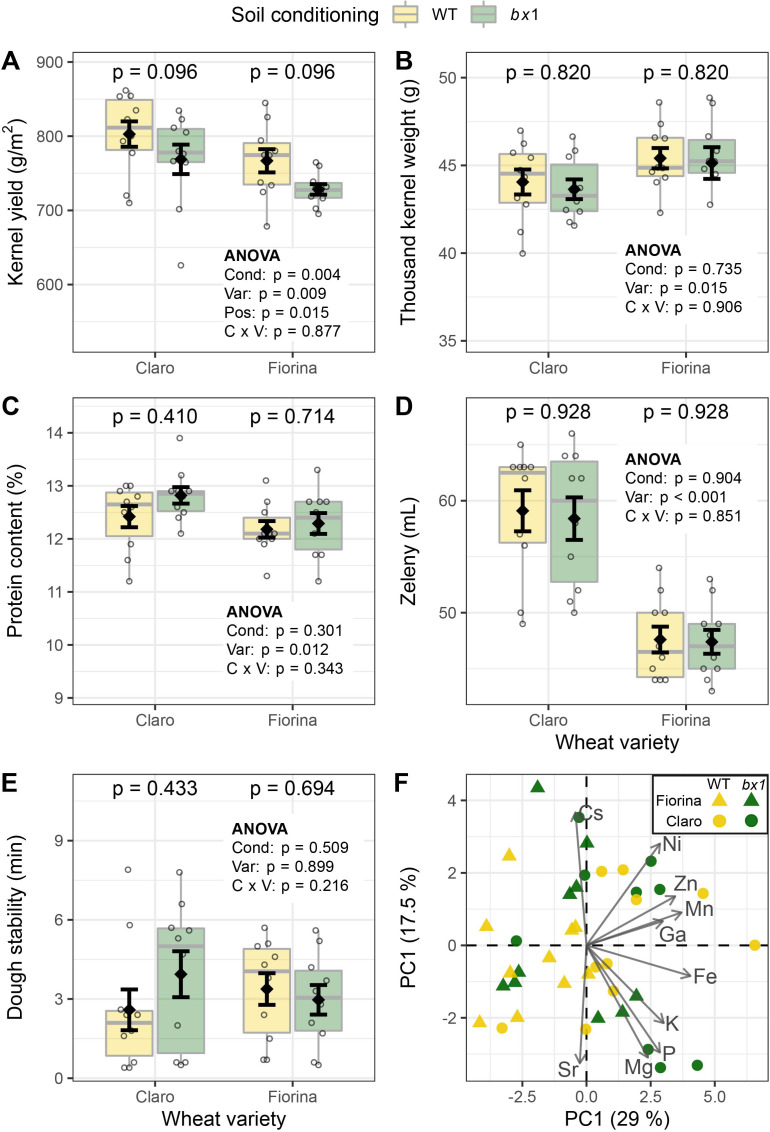
Figure 6—source data 1. Data of phenotypes shown in Figure 6, Figure 6—figure supplement 1 and Figure 6—figure supplement 2.

Figure 6.

Figure 6—figure supplement 1. Benzoxazinoid soil conditioning does not affect wheat kernel measurements and baking quality.

Figure 6—figure supplement 1.

(A) Kernels per tiller of three wheat varieties growing in soils previously conditioned with wild type (WT) or benzoxazinoid-deficient bx1 mutant maize (n=10). (B) Kernel weight per tiller (n=10), (C) kernel volume per weight (n=10), (D) kernel surface area (n=10), (E) kernel length (n=10), (F) kernel width (n=10), (G) falling number (flour quality, n=10), (H) flour water absorption (n=10), and (I) dough softening (n=9–10). Means ±SE, boxplots, and individual datapoints are shown. ANOVA tables and pairwise comparisons within each wheat variety (FDR-corrected p values) are included. Cond: soil conditioning (WT or bx1). Var: wheat variety. ‘C x V’: interaction between conditioning and wheat variety. Pos: position on the field. Note that the minimum values of the y-axes were set to a value greater than zero for clearer visualization of treatment differences.
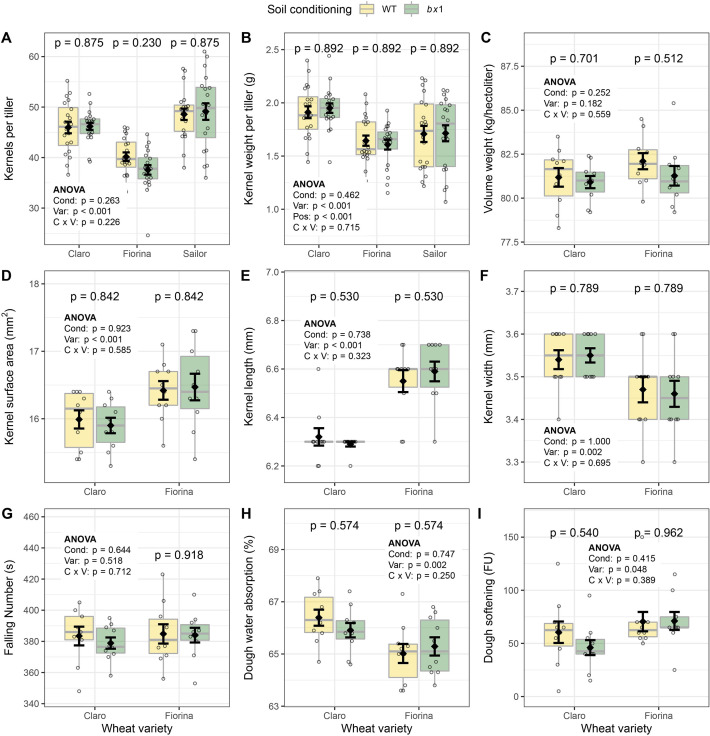
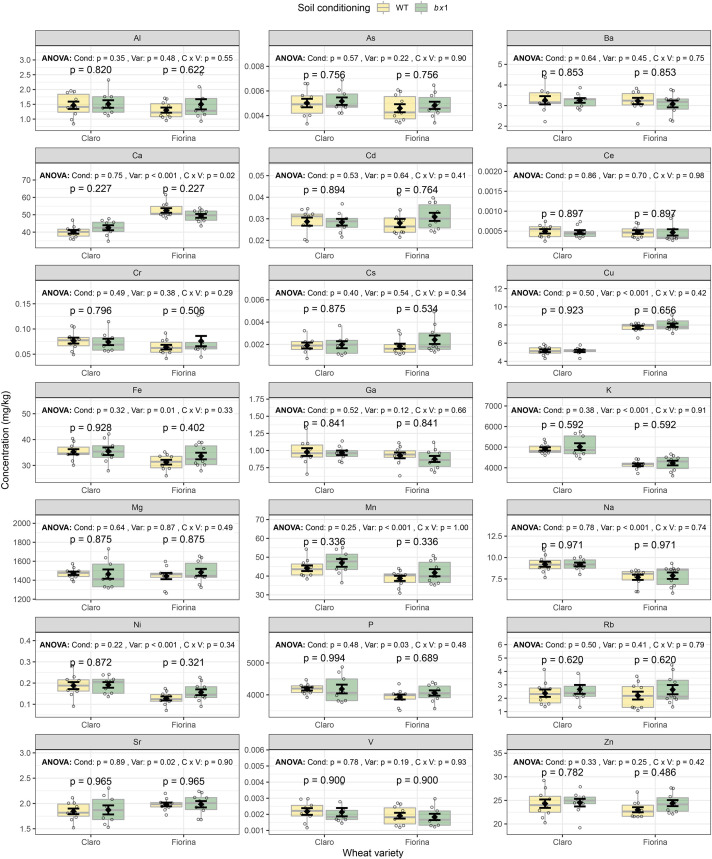
Figure 6—figure supplement 2. Benzoxazinoid soil conditioning does not affect micronutrient concentrations in wheat kernels.

Figure 6—figure supplement 2.

Concentration of individual elements in kernels of two wheat varieties growing in soils previously conditioned with wild type (WT) or benzoxazinoid-deficient bx1 mutant maize (n=8–10). Means ±SE, boxplots, and individual datapoints are shown. ANOVA tables and pairwise comparisons within each wheat variety (FDR-corrected p values) are included. Same data as shown in PCA Figure 6F. Cond: soil conditioning (WT or bx1). Var: wheat variety. ‘C x V’: interaction between conditioning and wheat variety. Note that the minimum values of the y-axes were set to a value greater than zero for clearer visualization of treatment differences.