. 2023 Jul 14;12:e89702. doi: 10.7554/eLife.89702

Figure 2. FKH-8 is expressed in sensory ciliated neurons, binds ciliome genes near DAF-19 X-boxes and physically interacts with DAF-19.

(A) fkh-8 locus (top) and fosmid based fkh-8 reporter (bottom). Grey boxes represent exons and orange boxes correspond to exons coding for the FKH DNA binding domain (DBD). Putative daf-19/RFX binding sites (X-boxes) are depicted with blue lines. Red bars indicate extension for the corresponding deletion alleles. (B) Dorso-ventral views of young adult animals expressing both the fosmid-based FKH-8::GFP reporter (in green) and an integrated reporter for the panciliary marker ift-20 (in red). A: anterior, P: posterior, R: right, L: left. Scale bar = 10 µm. See Figure 2—source data 1 for quantification and Figure 2—figure supplement 1 for embryonic expression patterns and expression correlation with DAF-19 and ciliome genes. (C) Genes associated to nearby FKH-8 binding events enrich Gene Ontology terms related to cilia regulated processes and/or functions. Data correspond to adjusted p-value. See Figure 2—source data 2 for gene lists associated to GO terms (D) De novo motif analysis of FKH-8 ChIP-seq data identifies a motif present in 27% of peaks, enriched at central positions, that matches a Forkhead like (FHL) motif. (E) DAF-19/RFX binding motifs (PWM M1534_1.02) are present in 21% of the FKH-8 bound regions and are enriched at central positions. See Figure 2—figure supplement 2 for similar analysis on additional FKH ChIP-seq data sets. (F) Distribution of ciliome genes in four different categories: (1) genes with both X-box motifs and FKH-8 binding events; (2) genes with only FKH-8 binding; (3) Genes with X-box motifs only and (4) Genes with neither FKH-8 binding or X-boxes. Most ciliome genes contain both X-boxes and FKH-8 peaks, this dual signature is highly prevalent in core ciliome genes while is minoritary in subtype ciliome genes. See Figure 2—source data 2 for gene lists associated to each signature. (G) Distance between X-boxes found in ciliome genes and the center of the nearest FKH-8 ChIP-seq peak. 42% of X-boxes are located less than 600 bp from a FKH-8 ChIP-seq peak. See Figure 2—figure supplement 2 for differential analysis of core and subtype ciliome genes. (H) Co-immuno precipitation of HA tag FKH-8 and FLAG tag DAF-19 expressed in HEK293 cells shows physical interaction between both transcription factors in the soluble fraction of nuclear extracts. MEK2 is used to assess for the presence of cytoplasmic components and Histone H3 to assess the presence of chromatin. See Figure 2—source data 3 for original blots and Figure 2—figure supplement 2 for additional analysis of interaction in chromatin associated fractions.

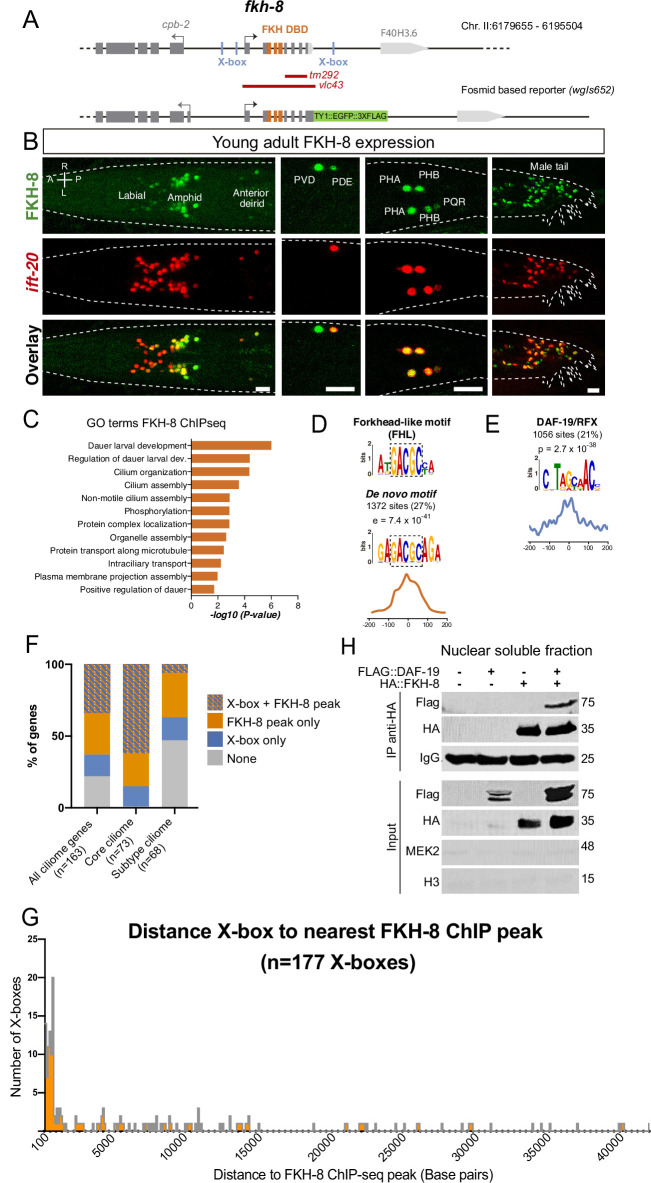
Figure 2—source data 1. Raw quantification data of FKH-8 and ift-20 reporter co-expression represented in Figure 2B.
Figure 2—source data 2. Raw data for bioinformatics analysis in Figure 2 and Figure 2—figure supplements 1 and 2.
elife-89702-fig2-data2.xlsx (168.2KB, xlsx)
Figure 2—source data 3. Co-IP original files of unedited gels in Figure 2.

Figure 2.

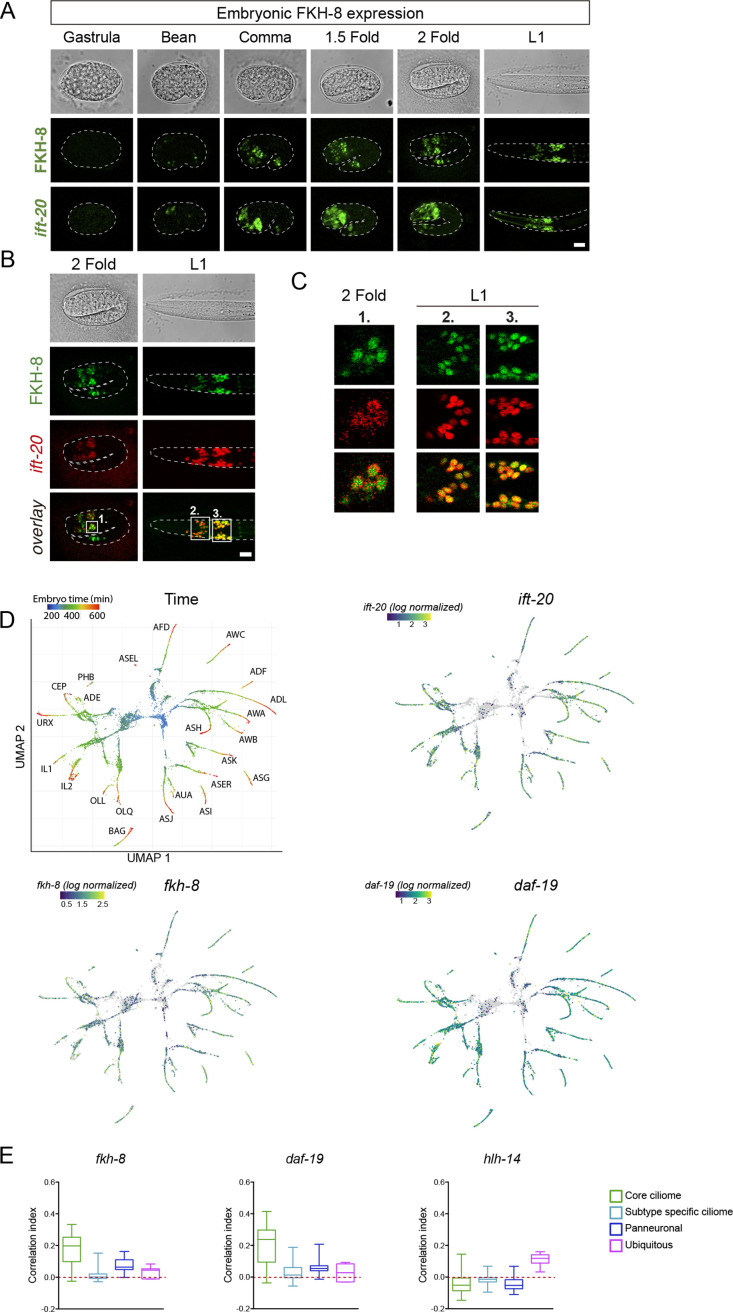
Figure 2—figure supplement 1. fkh-8 expression along ciliated system development.

Figure 2—figure supplement 1.

(A) Representative Z projections of developmental embryonic milestones until hatching (L1) shows FKH-8::GFP fosmid reporter expression matches in time and space panciliary reporter ift-20::gfp expression. Scale bar = 10 µm. (B) Representative Z projections of two fold embryo and fist larval stage (L1) animals expressing both FKH-8::GFP fosmid reporter (in green) and an integrated reporter for the panciliary marker ift-20:: tagRFP (in red). Note that due to long maturation time of the tag-RFP reporter, ift-20::tagRFP expression is only detected from the two fold stage, while ift-20::gfp reporter in (A) is first detected at bean stage, similar to fkh-8 expression. Scale bar = 10 µm. (C) Single Z-plane from regions indicated in (B) show colocalization of FKH-8::GFP and RFP in the ciliated sensory neurons. (D) Embryonic sc-RNA-data (Packer et al., 2019) from C. elegans ciliated neurons and their progenitor cells. Pseudo-time (left pannel) shows the maturation trajectory of ciliated neurons that coincides with increasing ift-20, fkh-8, and daf-19 expression. (E) Correlation index of fkh-8, daf-19 and hlh-14 TF scRNAseq expression and four different gene categories (core ciliome, subtype ciliome, panneuronal or ubiquitous) in all ciliated lineages (Packer et al., 2019). fkh-8 and daf-19 expression shows high correlation index with core ciliome genes but not with other gene categories, while hlh-14, bHLH TF not involved in ciliogenesis shows low correlation values in all categories. See Figure 2—source data 2 f for raw data.
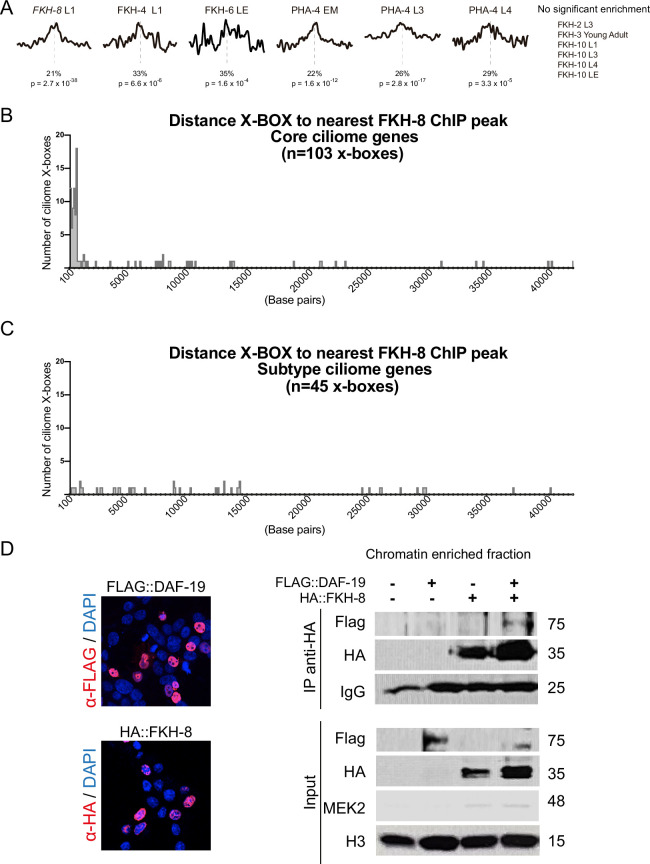
Figure 2—figure supplement 2. FKH-8 binds near X-BOX motifs.

Figure 2—figure supplement 2.

(A) Analysis of DAF-19/RFX binding motifs (PWM M1534_1.02) in peaks for ChIP-seq datasets of other C. elegans FKH TFs present in ENCODE database. There is no significant enrichment for DAF-19 motif in FKH-2, FKH-3, and FKH-10 datasets. Motif enrichment in FKH-4, FKH-6, and PHA-4 datasets is less significant and shows less defined enrichment in the centre of the peaks. p represents p Value associated to motif enrichment and % refers to the number of peaks with the motif present. EM: Embryo mixed stage; L1: Larval stage 1; L3: Larval stage 3, L4: Larval stage 4, LE: Late embryo. See Figure 2—source data 2 for detailed data. (B) Distance between X-boxes found in the promoter regions of core ciliome genes and the center of the nearest FKH-8 ChIP peak. 63% of X-boxes are located less than 600 bp from a FKH-8 ChIP peak. (C) Distance between X-boxes found in the promoter regions of subtype ciliome genes and the center of the nearest FKH-8 ChIP peak. 9% of X-boxes are located less than 600 bp from a FKH-8 ChIP peak. (D) Co-immuno precipitation of FKH-8 and DAF-19 expressed in HEK293 cells. Micrographs shows nuclear localization of transfected HA::FKH-8 and FLAG::DAF-19. In addition to the interaction detected in the soluble nuclear fraction (Figure 2), both factors also interact bound to DNA (chromatin fraction). See Figure 2—figure supplement 2—source data 1 for original blots.
Figure 2—figure supplement 2—source data 1. Co-IP original files of unedited gels for the chromatin fraction.