. 2023 Jul 14;12:e89702. doi: 10.7554/eLife.89702

Figure 3. FKH-8 TF and FKH-binding sites are required for correct core ciliome gene reporter expression.

(A) Dorso-ventral images from young adult heads expressing different core ciliome multicopy array gene reporters in wild type and fkh-8(vlc43) null mutant animals. All reporters are extrachromosomal arrays except for ift-20 reporter which is integrated. Arrow heads point deirid expression lost in the mutant. A: anterior, P: posterior, R: right, L: left. (B) Quantification of the number of gfp-positive cells in five distinct anatomical regions for each reporter in wild type, fkh-8(tm292) hypomorphic allele and fkh-8(vlc43) null mutant. To facilitate comparisons, values in each region are normalized to controls. The same extrachromosomal line was analyzed in the different genetic backgrounds. Each dot represents the number of reporter-expressing neurons scored in a single animal. Mean and standard error are represented. Black asterisk denotes significantly different from wild type and orange asterisk indicates vlc43 is significantly different from tm292 allele. Sample sizes for each genetic background: ift-20: n≥10; osm-9: n=9; osm-5: n≥8; peli-1: n≥7; xbx-1: n≥5. See Figure 3—source data 1 for raw scoring data, Figure 3—figure supplement 1 for analysis of the hypomorphic recessive nature of the tm292 allele and quantification of additional reporters not affected in fkh-8 mutants, see Figure 3—figure supplement 2 and Figure 3—source data 2 for functional characterization of predicted FKH binding sites in ift-20 and xbx-1 regulatory regions. (C) Dorso-ventral images from young adult heads expressing GFP from the endogenously tagged osm-5 locus [osm-5(syb6528), osm-5::SL2::GFP::H2B] in wild type and fkh-8(vlc43) null mutant. A global decrease in fluorescence intensity is detected in fkh-8(vlc43) animals compared to wild type. Scale bar = 25 µm. (D) Fluorescence intensity level quantification in specific ciliated neuron populations shows significant reduction of expression in fkh-8(vlc43) animals. A. U.: arbitrary units. See Figure 3—source data 1 for raw scoring data. n≥20 for each cell type and genetic background.

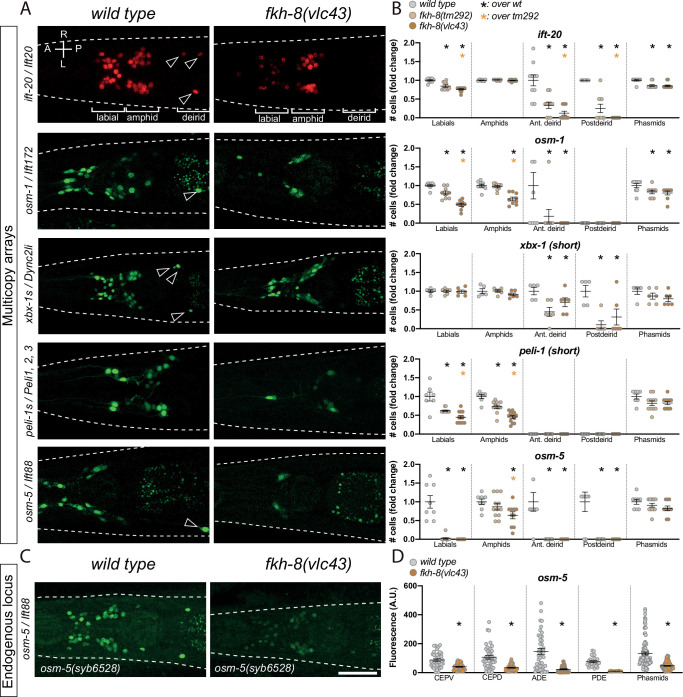
Figure 3—source data 1. Raw quantification data of ciliome gene reporter expression defects in fkh-8 mutants and cis-regulatory point mutation analysis corresponding to Figure 3 and Figure 3—figure supplements 1 and 2.
elife-89702-fig3-data1.xlsx (122.6KB, xlsx)
Figure 3—source data 2. Motif enrichment analysis of xbx-1 and ift-20 reporters.

Figure 3.

Figure 3—figure supplement 1. f. fkh-8(tm292) is a hypomorphic recessive allele.

Figure 3—figure supplement 1.

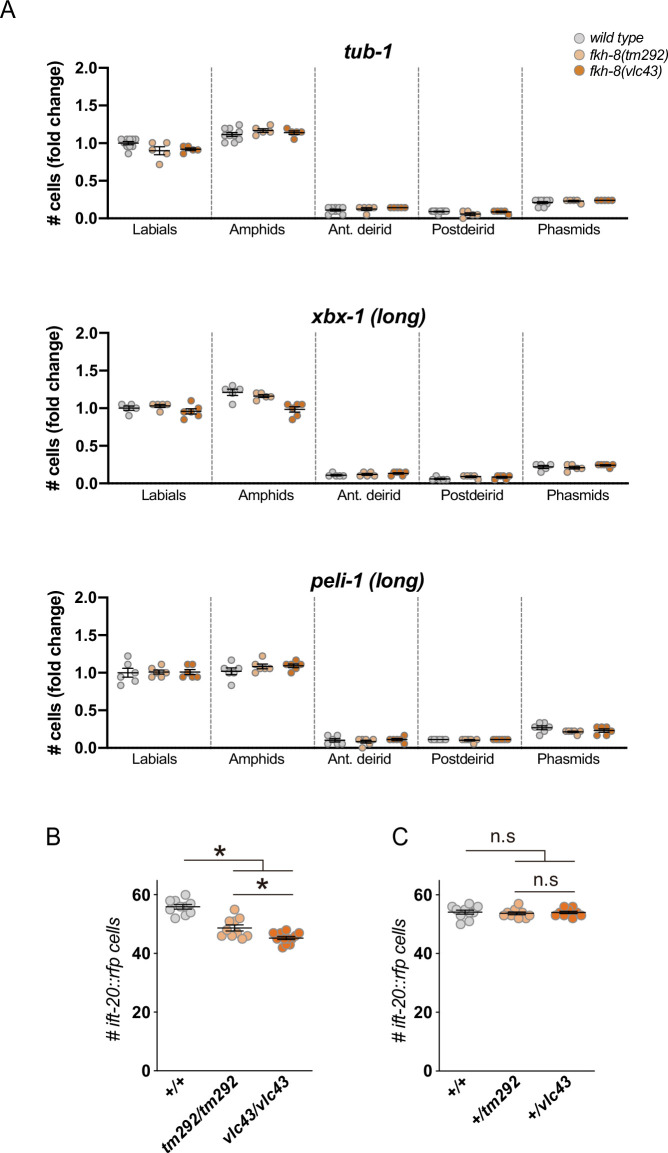
(A) Quantification of the number of gfp-positive cells in five distinct anatomical regions for each reporter in wild type, fkh-8(tm292) hypomorphic allele and fkh-8(vlc43) null mutant. To facilitate comparisons, values in each region are normalized to controls. The same extrachromosomal line was analyzed in the different genetic backgrounds. Each dot represents the number of reporter-expressing neurons scored in a single animal. Mean and standard error are represented. fkh-8(tm292) and fkh-8(vlc43) show similar expression values than wild type for these markers. See Figure 3—source data 1 for raw scoring data. (B) Quantification of the number of ift-20::rfp-positive cells in wild type, fkh-8(tm292) and fkh-8(vlc43) mutants shows stronger defects in vlc43 null allele.: n≥5. (C) Heterozygote cross progeny from wild type, fkh-8(tm292) and fkh-8(vlc43) show similar number of ift-20::rfp-positive cells denoting the recessive nature of both alleles. n≥10.
Figure 3—figure supplement 2. f. Functional characterization of putative FKH sites in cis-regulatory modules of two core ciliome components.

Figure 3—figure supplement 2.

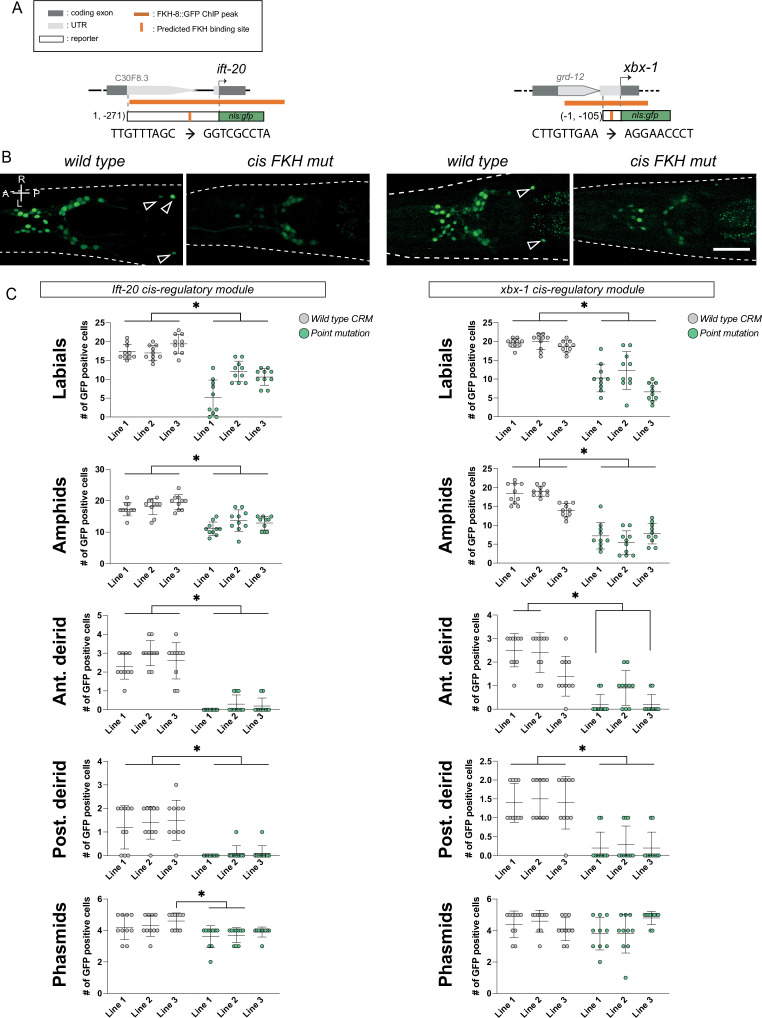
(A) Schematics for the ift-20 and xbx-1 loci and reporters. Dark grey boxes represent exons whereas light grey boxes correspond to UTRs. FKH-8 Chip-seq peaks are depicted with an orange horizontal line while predicted FKH DNA binding motifs are indicated with a vertical orange bar. Sequences corresponding to wild type and mutated putative FKH sites are indicated. See Figure 3—source data 2 for FKH putative binding site assignment. (B) Cis-regulatory mutation of putative FKH sites greatly reduces ciliome gene reporter expression. Representative dorso-ventral images from young adult heads expressing wild type or FKH-site-mutated reporters for core ciliome genes ift-20 (left) and xbx-1 (right). A: anterior, P: posterior, R: right, L: left. Scale bar = 25 µm. (C) Quantification of total number of gfp-positive cells for wild type and point mutated gfp reporters. Each graph represents one of the five anatomical regions scored. Three different extrachromosomal lines were analyzed for each construct. Each dot represents the number of reporter-expressing neurons scored in a single animal. Statistically significant differences are indicated with asterisks. See Figure 3—source data 1 for raw scoring data. n=10.