
Figure 5.
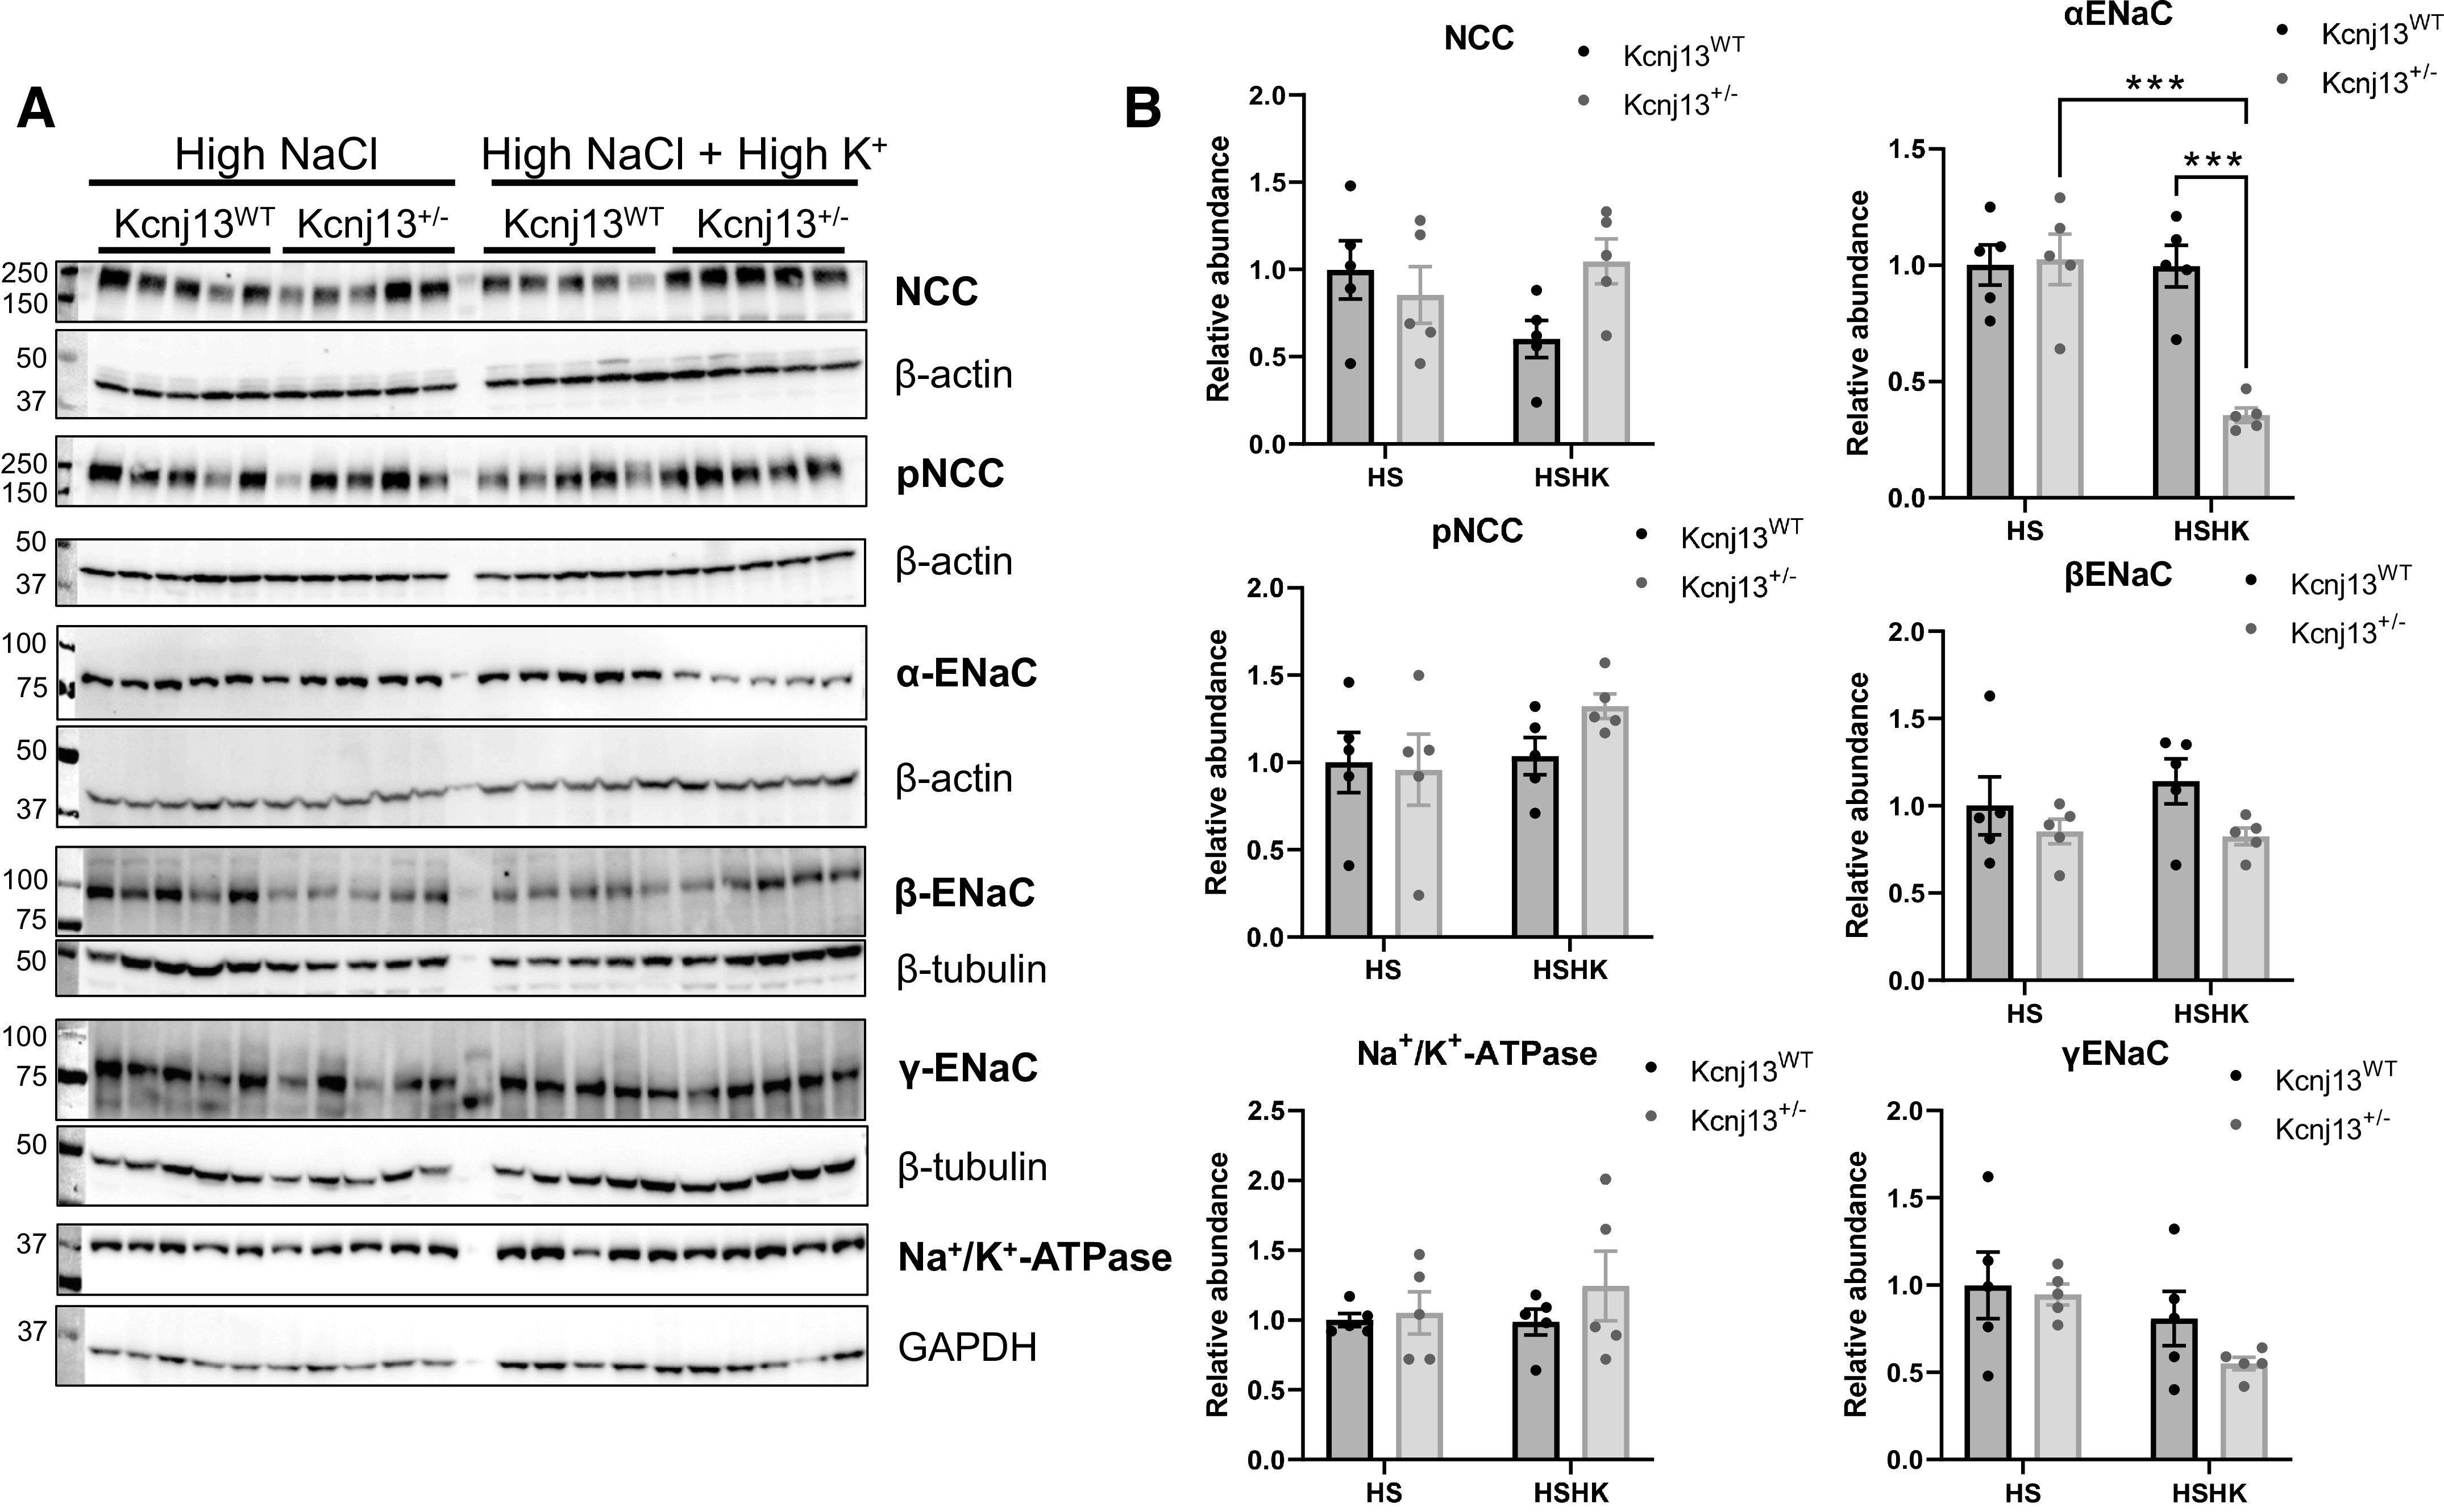
Changes in expression of Na+ channels and transporters in Kcnj13+/− rats fed a high-salt diet. A: Western blot analysis of Na+-Cl− cotransporter (NCC), phosphorylated NCC (pNCC), α-epithelial Na+ channel (ENaC), β-ENaC, γ-ENaC, and Na+/K+-ATPase α1-subunit. B: relative band density normalized to the loading control. Data were compared using two-way ANOVA. n = 5 subjects in each group. ***P < 0.001. HS, high salt; HSHK, HS supplemented with high K+; WT, wild type.