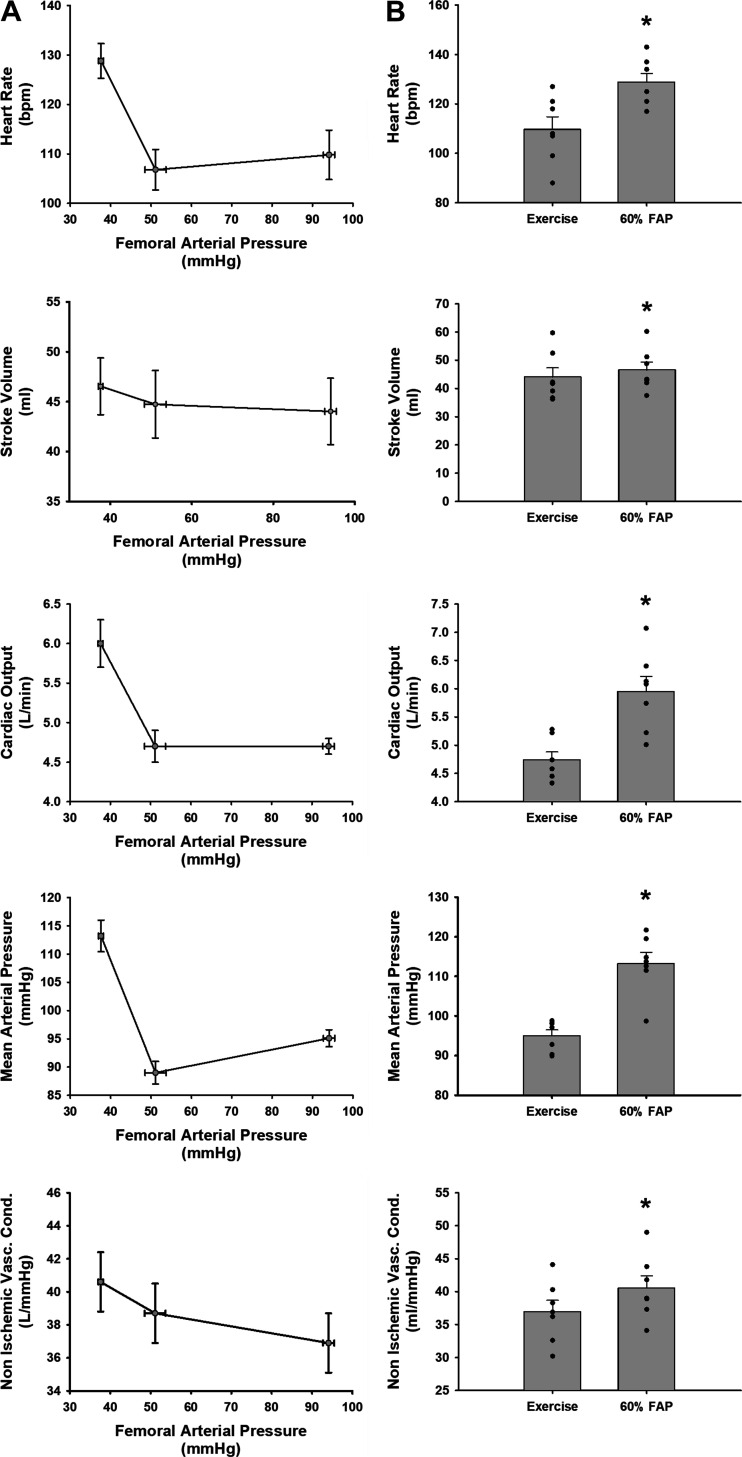
Figure 1.
A: linear regressions of steady-state values during exercise and during exercise with 60% reduction in femoral arterial pressure. Graphs should be read right to left: the first point is exercise, the second point is the threshold where the given variable changes because of a reduction in femoral arterial pressure, and the furthest left point is the average peak value for a given variable at a 60% reduction in femoral arterial pressure during exercise. Error bars show SE of the mean in both directions. B: average 1-min steady-state values of heart rate, stroke volume, cardiac output, mean arterial pressure, and nonischemic vascular conductance during free-flow exercise (left bar) and during a 60% reduction in femoral arterial pressure (FAP) during exercise (right bar). Error bars show SE. *Significance vs. the previous setting was determined by a P < 0.05 (N = 7 animals, Student’s paired t test).

