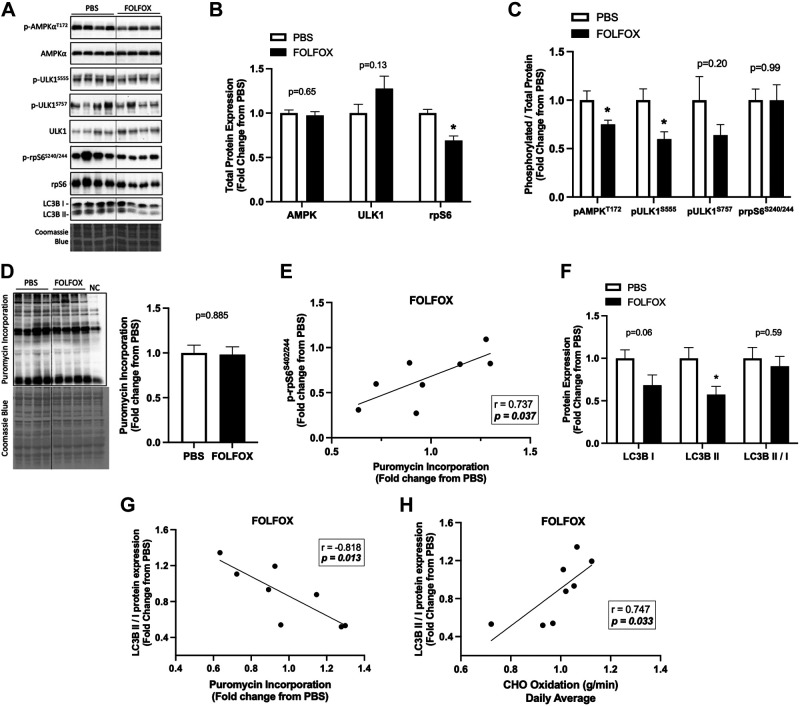
Figure 4.
Four cycles of FOLFOX chemotherapy disrupts skeletal muscle metabolic and autophagy signaling after a 12-h fast. A: representative Western blot images with Coomassie blue protein stain, dashed line represents different areas of the same blot. Red gastrocnemius skeletal muscle total protein expression of AMPK, ULK1, and rpS6 (B). C: phosphorylated to total ratio of AMPK (T172), ULK1 (S555), ULK1 (S757), and rpS6 (S240/244). D: puromycin incorporation with representative Western blot and Coomassie blue protein stain, dashed line represents different areas of the same blot. E: Pearson r correlation between phosphorylated (p) rpS6 (S240/244) red gastrocnemius protein expression to protein synthesis in FOLFOX mice. F: protein expression of LC3BI, LC3BII, and the LC3BII/I ratio. G: Pearson r correlation between LC3BII/I and protein synthesis and CHO oxidation in FOLFOX mice (H). PBS: n = 8, FOLFOX: n = 8. Data are presented as means ± SE. Data are analyzed using unpaired t test and correlation with Pearson r correlation coefficient. Statistical significance was set to P < 0.05. Bold and italic values denote significance. *Different from PBS. AMPK, AMP-activated protein kinase; FOLFOX, 5-fluorouracil, leucovorin, oxaliplatin; LC3B, microtubule-associated protein 1 light chain 3B; NC, negative control; rpS6, ribosomal protein S6; ULK1, unc-51-like kinase 1.

