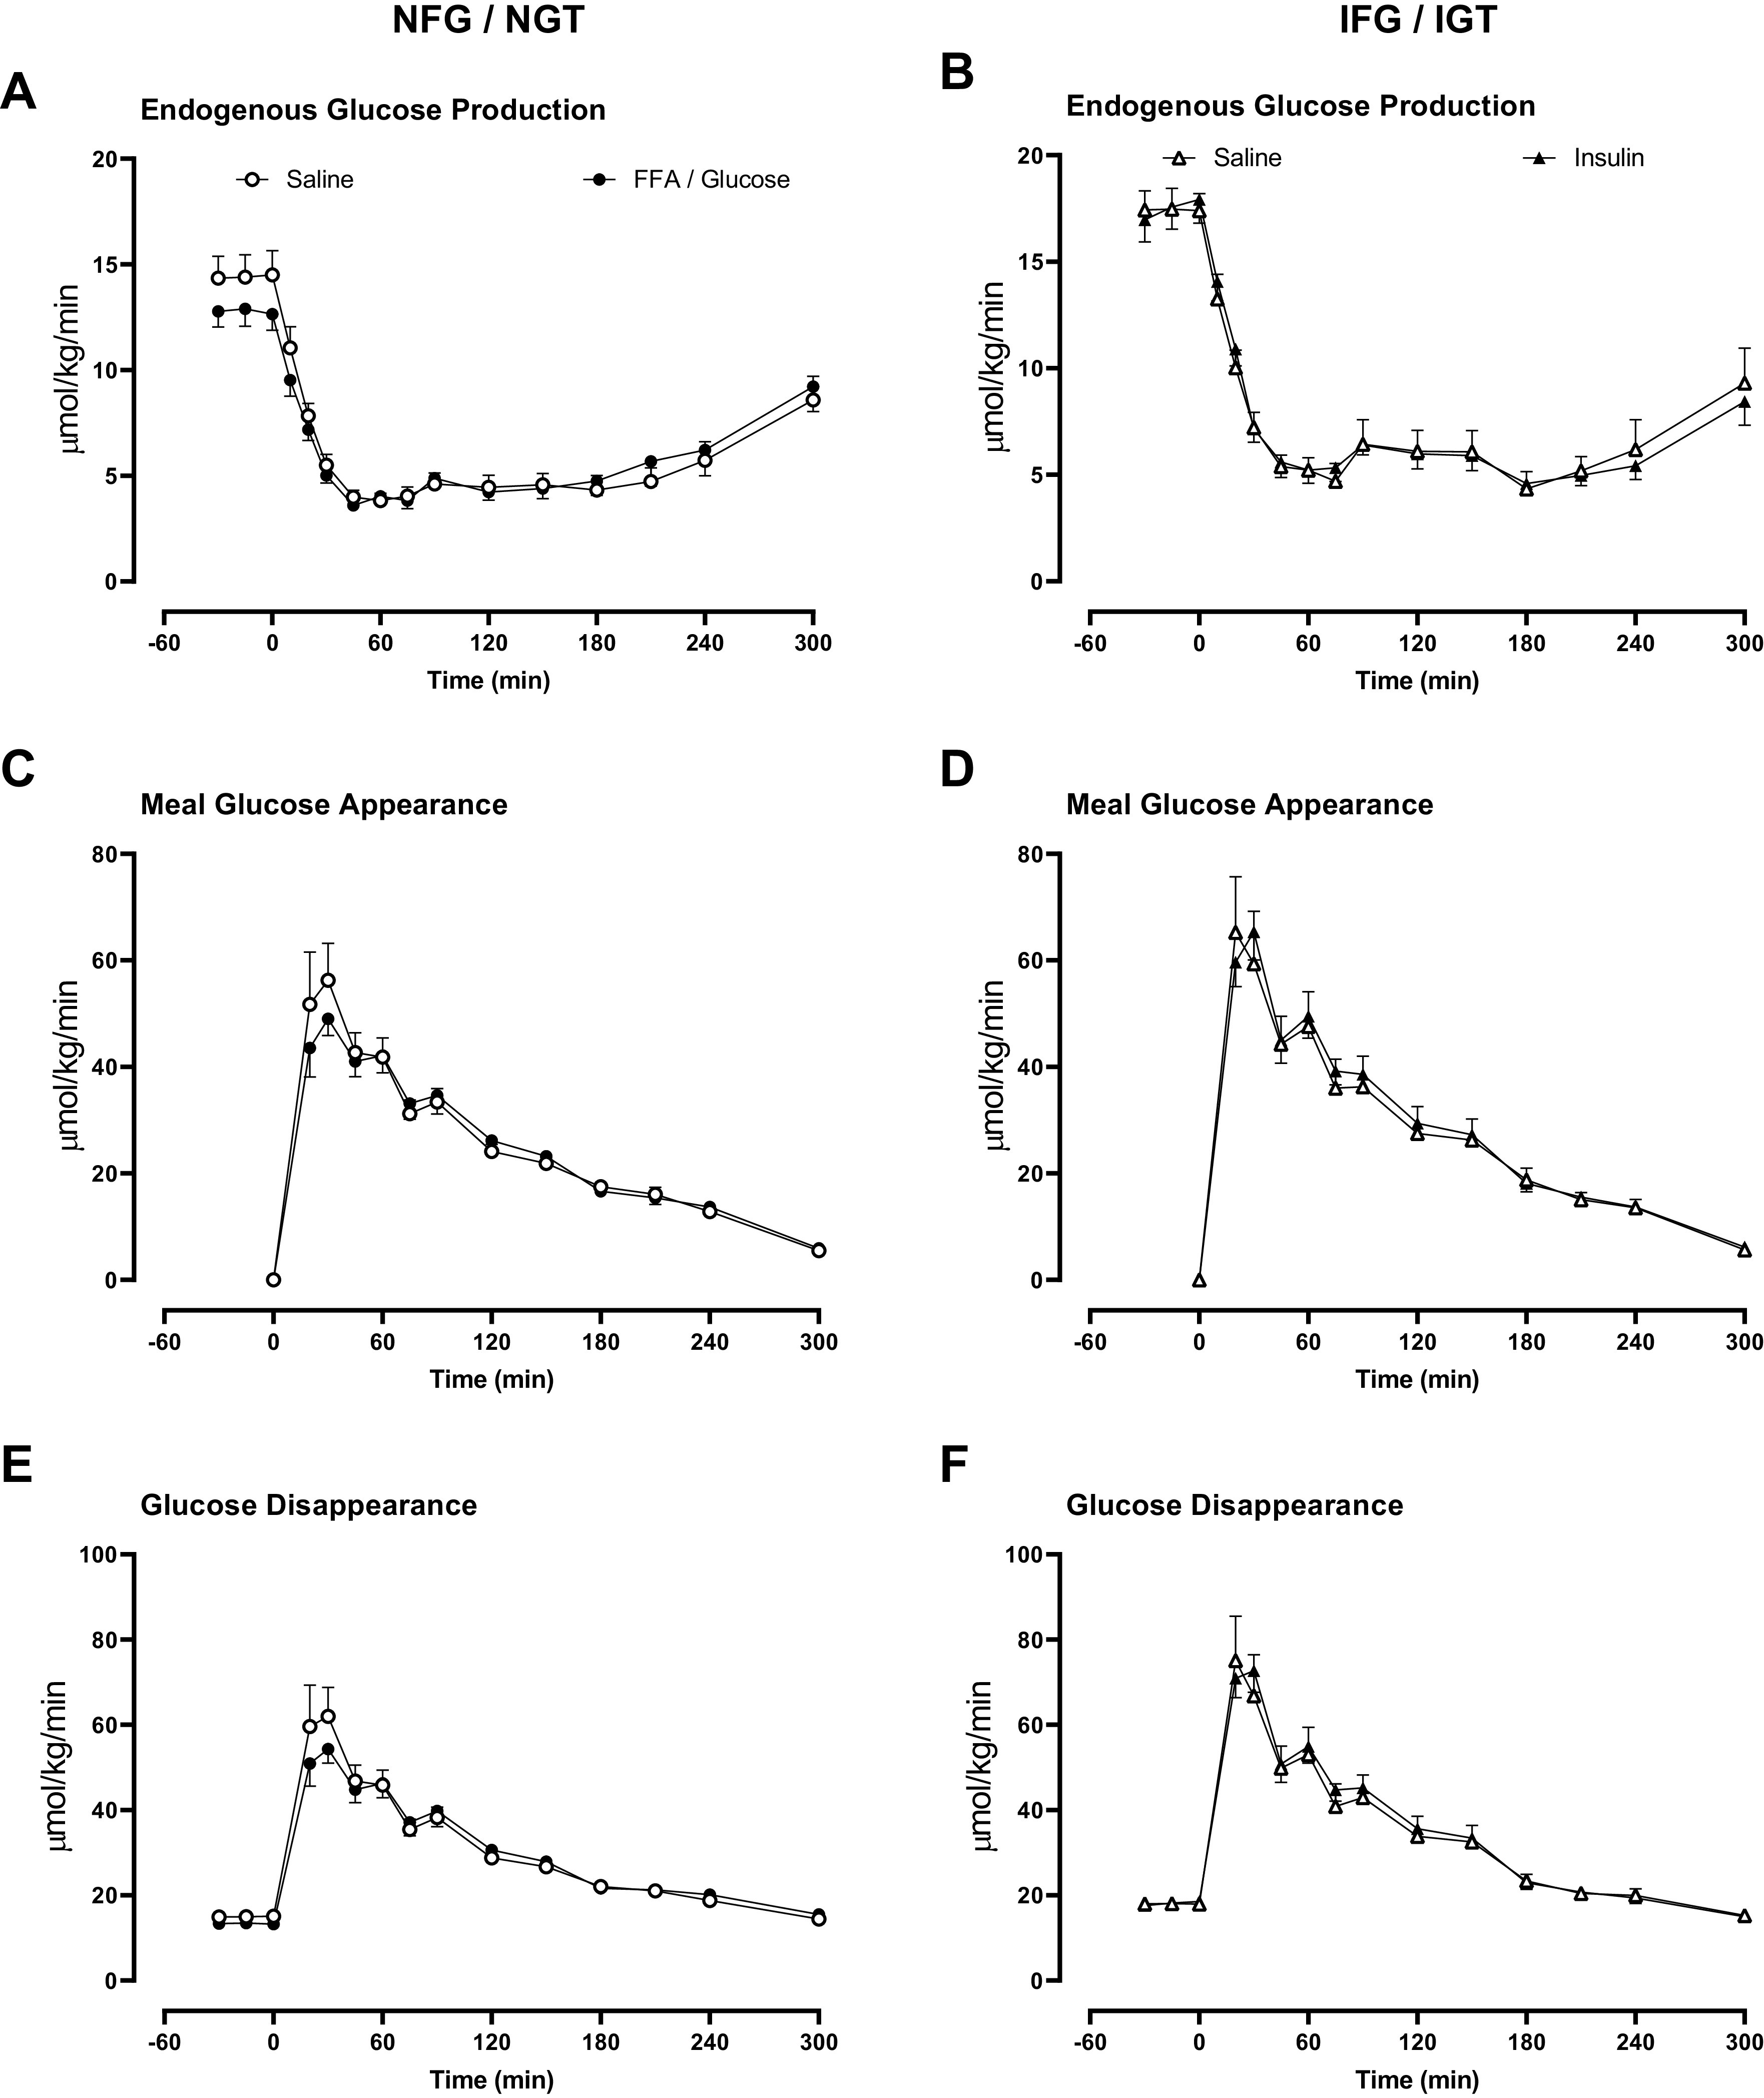
Figure 4.

Rates of endogenous glucose production (A and B), meal glucose appearance (C and D), and glucose disappearance (E and F) in people with normal fasting glucose and normal glucose tolerance and in people with impaired fasting glucose and impaired glucose tolerance. Rates are shown during the meal after saline infusion (○ or in the case of IFG/IGT Δ), Intralipid and glucose infusion (•), and during insulin infusion (▴).
