Figure 3.
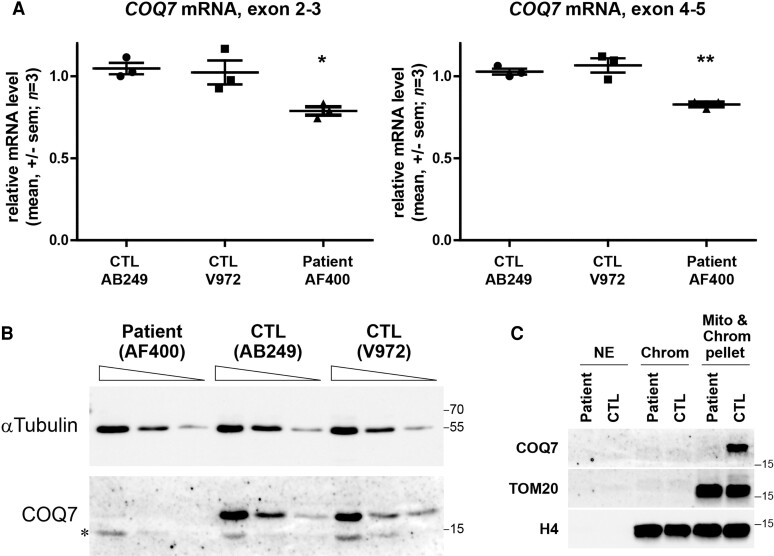
COQ7 c.3G>T mutation decreases COQ7 protein level in the patient’s fibroblasts. (A) Quantification of COQ7 mRNA in the control (CTL) and patient’s fibroblasts using two primer pairs targeting exon 2–3 and exon 4–5. Values represent mean ± standard error of the mean. *P < 0.05; **P < 0.01; n = 3; one-way ANOVA followed by Bonferroni’s multiple comparison test. (B) Western blot analysis of control and patient’s fibroblasts using anti-COQ7 antibodies and α-tubulin gene to normalize. Protein loading 4×, 2×, and 1× for each condition. Stars show the non-specific histone band (Supplementary Fig. 3C and D). (C) Nuclear extract (NE), benzonase soluble (Chrom), and insoluble (Chrom & Mito Pellet) fractionation revealed by western blotting using anti-COQ7 antibodies to stain COQ7 protein, anti-TOM20 antibodies to stain mitochondria, and anti-H4 antibodies to stain H4 histones in the control and patient’s fibroblasts.

