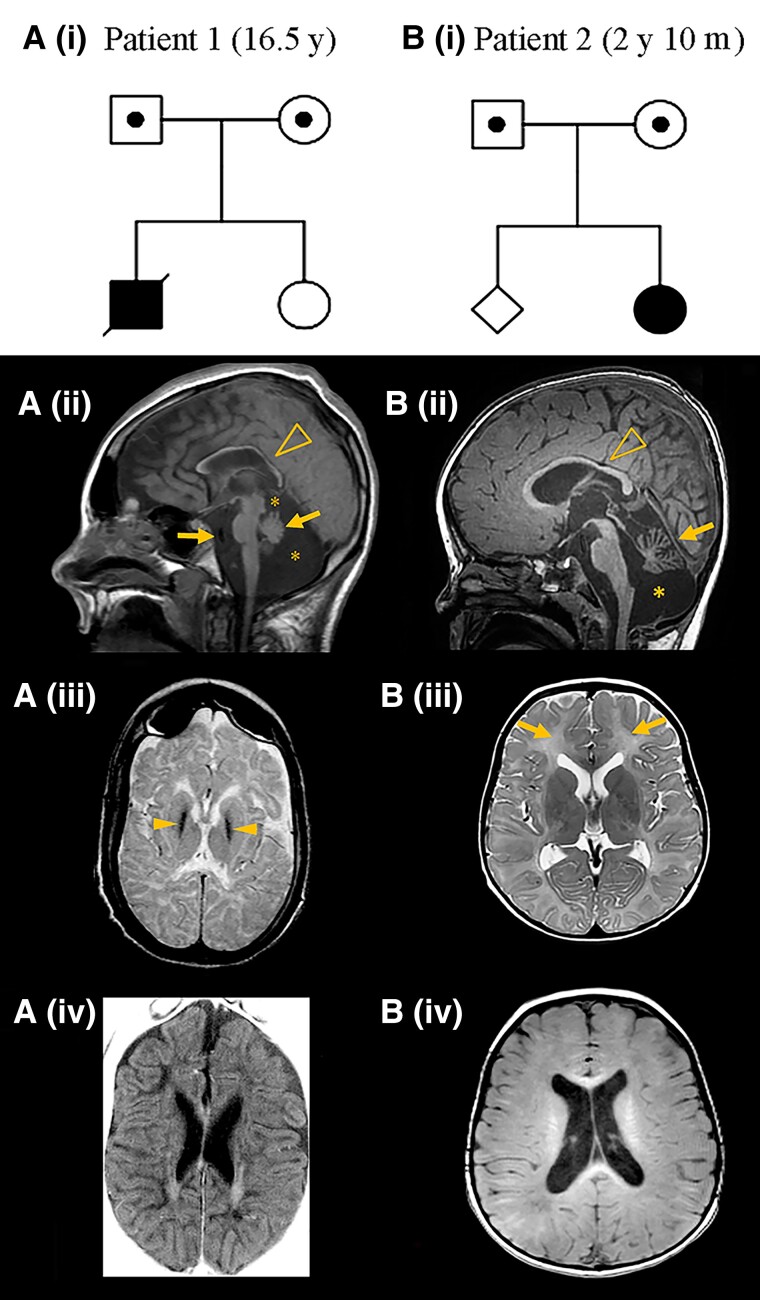
Figure 1.
Family pedigrees, POLR1A variant segregation and brain MRI of patients. [A(i) and B(i)] The POLR1A variant status is indicated as homozygous (filled symbols) and heterozygous (dotted symbols) in the pedigrees. Age of the patient at MRI examination is indicated in parenthesis. [A(ii)] Midline sagittal T1-weighted image shows a thin corpus callosum (arrowhead), a small cerebellum (arrow), prominent cisterns (asterisks), mild scalloping of the occipital bone, decreased pontine area, thin medulla oblongata and enlarged retroclival CSF space (arrow). [A(iii)] Axial T2-weighted image shows marked hypointensity of the globi pallidi (arrowheads). Basal ganglia and thalami have a small volume. [A(iv)] Axial T1-weighted image shows enlarged lateral ventricles and subarachnoid spaces with a reduced volume of white matter, as well as hypointensity of the supratentorial white matter, suggesting hypomyelination with some residual T1 hyperintensity parallel to the lateral ventricles. [B(ii)] Midline sagittal T1-weighted image shows a mildly thin corpus callosum (arrowhead), a small cerebellum (arrow) and an enlarged cisterna magna (asterisk), with additional evidence of cerebellar atrophy. [B(iii)] shows diffusely elevated T2 signal in the entire supratentorial white matter (arrows), suggesting hypomyelination. Size and signal of the basal ganglia and thalami are normal. [B(iv)] T1 signal was hyperintense in the central white matter, hypointense in the parietooccipital white matter and isointense to the cortex in most of the remaining white matter, with some areas of hyperintensity in the subcortical white matter.

