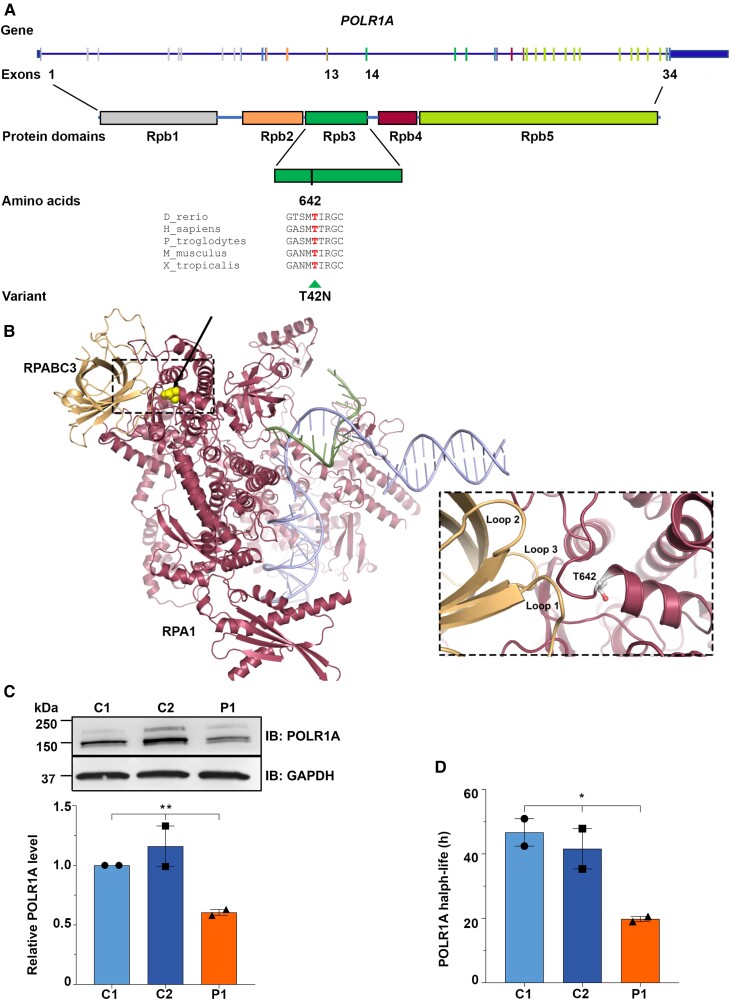
Figure 2.
Schematic representation of POLR1A and the encoded protein, in silico analysis of POLR1A T642N and expression of mutant POLR1A. (A) Schematic drawing of POLR1A (NM_015425.6) and the encoded protein with domains (NP_056240.2) showing the position of the variant T642N in exon 14 detected in homozygosity in patients. Phylogenetic analyses showed high evolutionary conservation of T642, suggesting that this residue is essential for the function of the protein. POLR1A is shown as a blue line and the vertical bars depict the exons. Exons have the same colours as the encoded functional domains. (B) POLR1A model (raspberry red) in association with nascent RNA (green) and DNA (light blue) molecules. On the left, interaction with RPABC3 subunit (orange) is shown. The position of the variant is yellow (indicated by the arrow). The inset shows RPABC3 loops 1–3 that are all close to the T642 position in POLR1A. (C) Representative immunoblot (top) and relative quantification of POLR1A protein (bottom) in cells from Patient 1 (P1) and controls (C1 and C2). GAPDH was used as loading control. (D) Histogram showing POLR1A half-life as measured by CHX time course. (C and D) *P ≤ 0.05, **P ≤ 0.01 (two-tailed Student's t-test).

