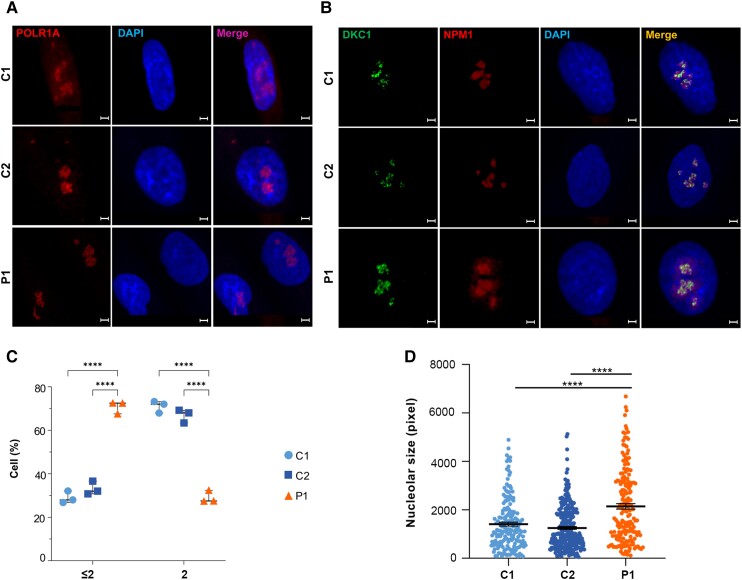
Figure 3.
Immunofluorescence studies on fibroblasts from Patient 1 showed that POLR1A T642N maintained its nucleolar localization but presented defective nucleolar homeostasis. (A) Staining of POLR1A (in red, left column) and of the nucleus (in blue, middle column) shows that POLR1A localized to the nucleolus in fibroblasts from Patient 1 (P1) and controls (C1 and C2). Scale bars = 5 µm. (B) Identification of the nucleoli using the nucleolar markers DKC1 (green, first column from left) and NPM1 (red, second column from left). Scale bars = 5 µm. (C) Quantification of the number of nucleoli (≤2 or >2) per fibroblast. Fibroblasts from Patient 1 showed an increased fraction of cells with ≤2 nucleoli as well as a lower fraction of cells with >2 compared to controls. Bars indicate mean ± SD. *P ≤ 0.05 (two-tailed Student's t-test). (D) Total nucleolar size determined by boundaries of NPM1 immunostaining. Bars indicate mean ± SEM for n > 30 cells per cell type. ****P ≤ 0.0001 (two-tailed Student's t-test).

