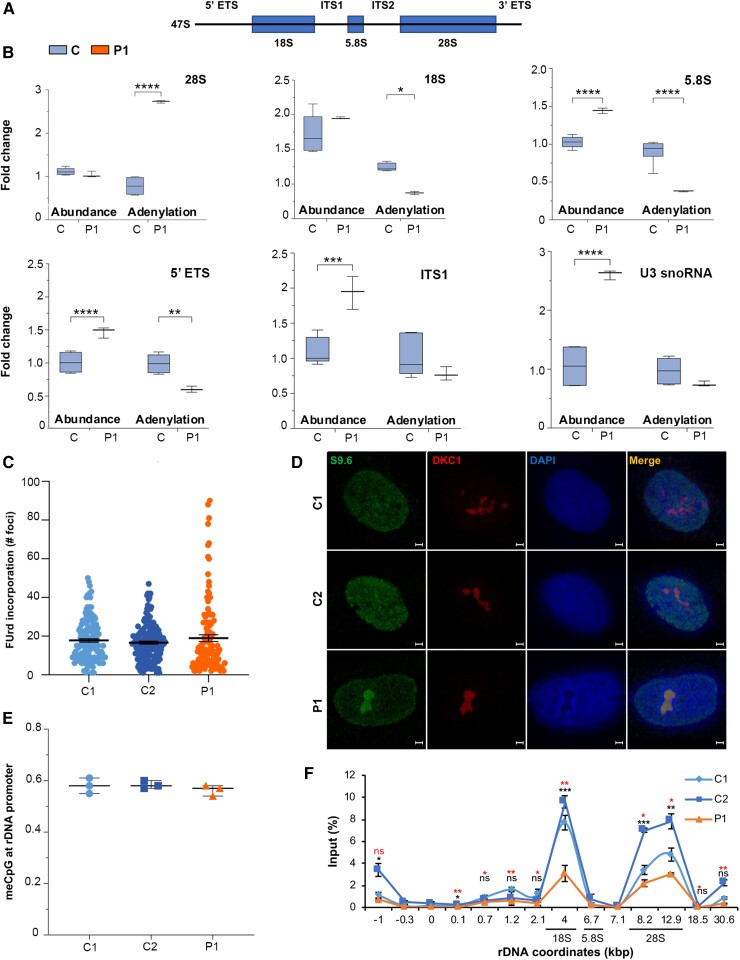
Figure 4.
rRNA processing anomalies in cells expressing POLR1A T642N. (A) Schematic representation of 47S pre-rRNA primary transcript. (B) Quantification of immature and mature rRNA (abundance and polyadenylation) products and U3 snoRNA levels measured by qPCR. cDNA was synthesized with random or oligo(dT) primers. Relative abundance was measured using cDNA synthesized with random primers while adenylation frequency was estimated as the ratio of oligo(dT)-primed cDNA to random-primed cDNA. (C) Nucleolar transcription as measured by quantification of FUrd incorporation in the newly synthesized rRNA molecules. Box plot showing FUrd incorporation measured as number of FUrd foci per cell in Patient 1 (P1) compared to controls (C1 and C2). Data are shown as the number of foci per cell. (D) Immunofluorescence images showing accumulation of RNA:DNA hybrids (S9.6, in green, first column from left) in the nucleoli of Patient 1. DKC1 (in red, second column from left) was used as nucleolar marker. Scale bars = 5 µm. (E) Methyl CpG analyses at −59 CpG island at rDNA promoter. (F) RNA polymerase I I occupancy analysis on rDNA as measured by ChIP. Lower row of P-value (asterisks in red) comparison of C1 to P1; upper row of P-value (asterisks in black) comparison of C2 to P1; ns = not significant. (B and F) *P ≤ 0.05, **P ≤ 0.01, ***P ≤ 0.001, ****P ≤ 0.0001 (two-tailed Student's t-test).

