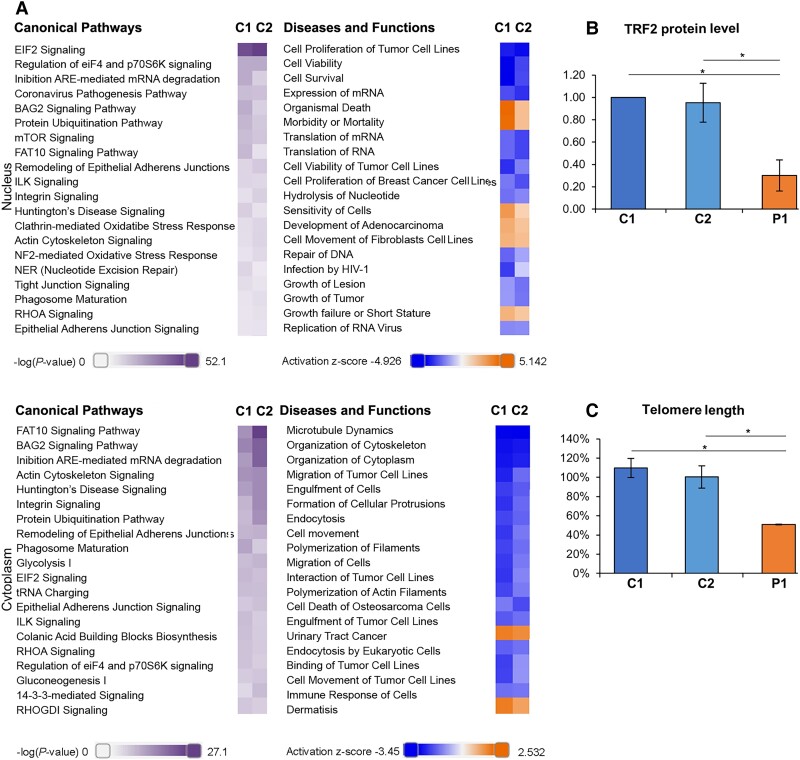
Figure 5.
POLR1A T642N showed increased ER stress and reduced telomere homeostasis. (A) IPA analysis of the proteomics data from fibroblasts of Patient 1 and controls showing the top 20 Canonical pathways (left) and Diseases and Functions categories (right) dysregulated in Patient 1 versus controls (C1 and C2) in the nuclear proteome (Nucleus) and in the cytoplasmic proteome (Cytoplasm). Lilla scale bar = −log(P-value); orange-blue scale bar = Activation z-score. For example: orange indicates that a Diseases and Functions category is more active in patient compared to controls. See also Supplementary Table 4. (B) Quantification of TRF2 expression levels as measured by western assay in Patient 1 and control cells. (C) Quantification of telomere length as measured by qPCR. (B and C) Mean ± SD, *P ≤ 0.05 (two-tailed Student's t-test).

