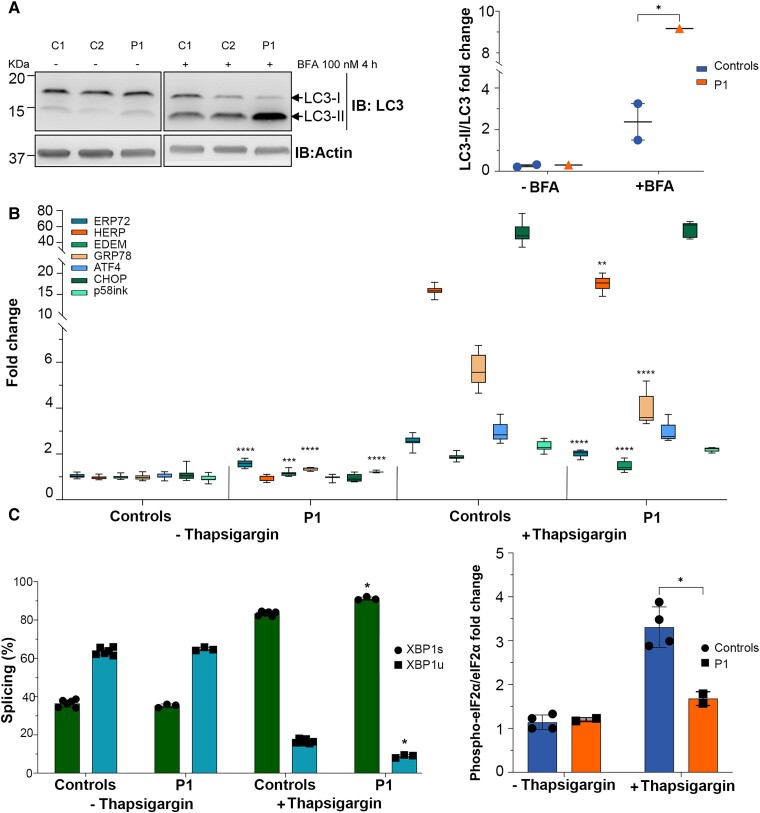
Figure 6.
POLR1A T642N led to increased autophagy and UPR stress. (A) Representative immunoblot for LC3-I and LC3-II (left) and quantification of the autophagic flux as ratio LC3-II/LC3-I (right). β-Actin was used as loading control. (B) Fold changes depicting the activation of UPR pathway. Thapsigargin was used as positive control for the UPR activation.71 ERP72 (PDIA4), HERP (HERPUD1), EDEM (EDEM1), GRP78 (HSPA5), ATF4 (ATF4), CHOP (DDIT3) and p58ink (DNAJC3) levels are shown (the HGNC name of each protein is shown within parentheses). (C) Histogram showing the splicing ratio of XBP1 mRNA in P1 and control fibroblasts after treatment with thapsigargin. XBP1s = spliced; XBP1u = unspliced. (D) Quantification of phospho-eiF2α/eiF2α ratio as measured by western blotting in P1 and control cells treated with thapsigargin. (B–D) Mean ± SD, *P ≤ 0.05, **P ≤ 0.01, ***P ≤ 0.001, ****P ≤ 0.0001 (two-tailed Student's t-test, patient versus controls).

