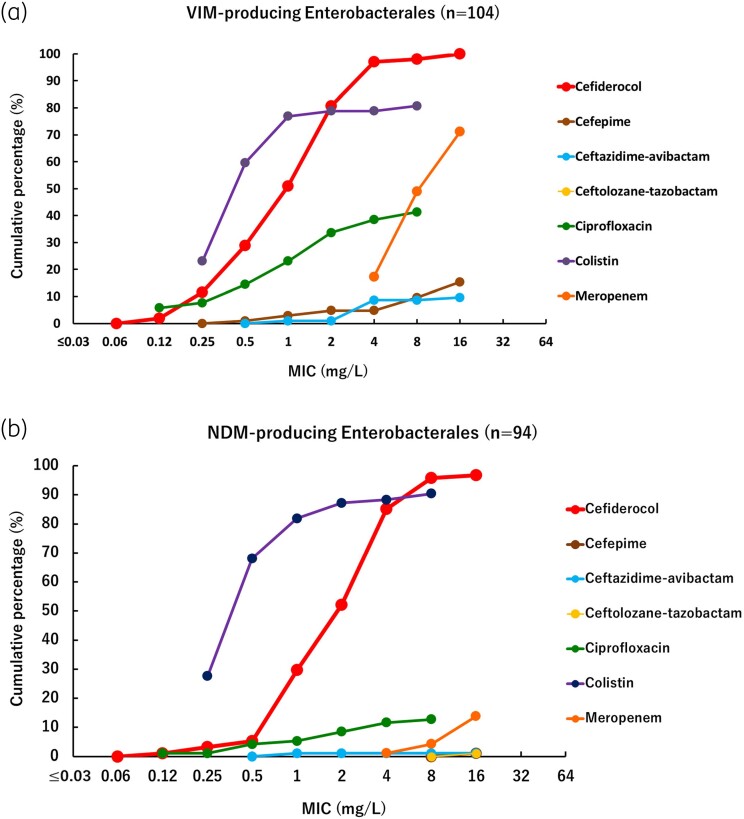
Figure 2.
Cumulative percentage MIC distributions of cefiderocol and comparator agents against MBL-producing Enterobacterales strains. (a) VIM-producing Enterobacterales (n = 104). Data for strains above the upper end of the MIC measurement range are not plotted. Ceftolozane/tazobactam MIC values were >16 mg/L against all strains, so not plotted on graph. In the ciprofloxacin plot, the MIC value of 0.12 mg/L means ≤0.12 mg/L. In the colistin plot, the MIC value of 0.25 mg/L means ≤0.25 mg/L. VIM-producing Enterobacterales were screened among Enterobacterales with meropenem MICs ≥ 4 mg/L, so meropenem MICs are not plotted below 4 mg/L. (b) NDM-producing Enterobacterales (n = 94). Data for strains above the upper end of the MIC measurement range are not plotted. In the ciprofloxacin plot, the MIC value of 0.12 mg/L means ≤0.12 mg/L. In the colistin plot, the MIC value of 0.25 mg/L means ≤0.25 mg/L. NDM-producing Enterobacterales were screened among Enterobacterales with meropenem MICs ≥ 4 mg/L, so meropenem MICs are not plotted below 4 mg/L.

