
Figure 3.
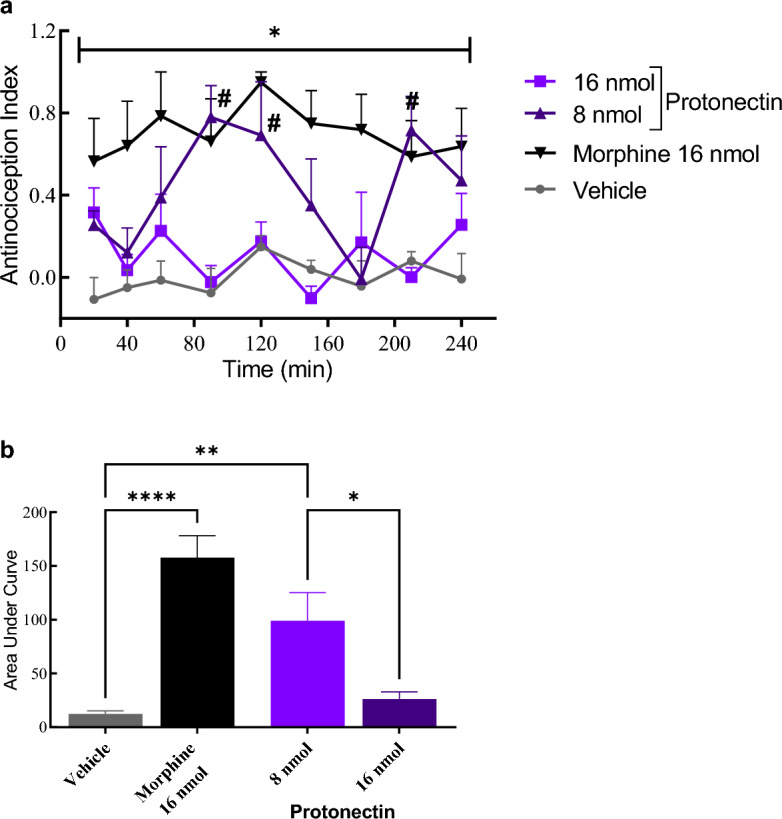
(a) Antinociception index obtained from the hot plate assay after i.c.v. injection of natural protonectin at 8 nmol/animal or at 16 nmol/animal. Control groups received either morphine at 16 nmol per animal or vehicle solution. Data were analyzed with Two-Way ANOVA followed by Bonferroni post-hoc test. (*) indicates statistical difference when compared morphine to vehicle control (* = p < 0.05). (#) indicates difference when compared Protonectin-F 16 nmol to vehicle control with p < 0.05. (b)- Area under curve obtained from the antinociception index results. Data were analyzed by ANOVA followed by Tukey’s post-hoc test. (*) indicates statistical difference (**** = p < 0.0001; ** = p < 0.01; * = p < 0.05).