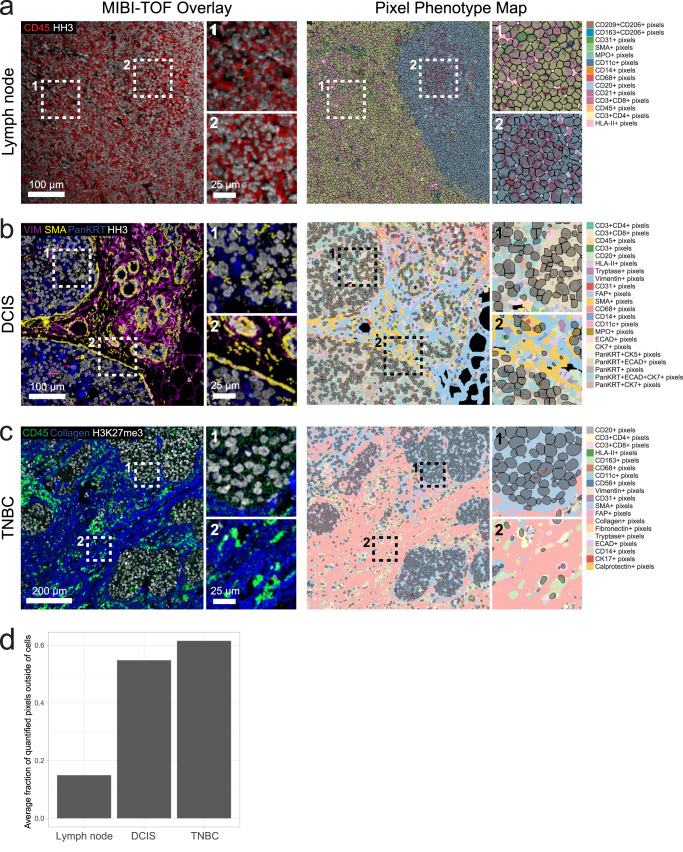
Fig. 3. Pixie captures more information in multiplexed images than cell segmentation masks alone.
Representative FOVs from (a) lymph node, (b) ductal carcinoma in situ (DCIS), and (c) triple negative breast cancer (TNBC), showing MIBI-TOF overlays (left) and pixel phenotype maps (right). Cells identified using cell segmentation are overlaid on the pixel phenotype maps in gray. Colors of the pixel phenotype maps correspond to the phenotypes indicated on the right. d Comparison of the average fraction of quantified pixels (pixels that were included in pixel clustering) that were outside of the cell segmentation masks across the three datasets.

