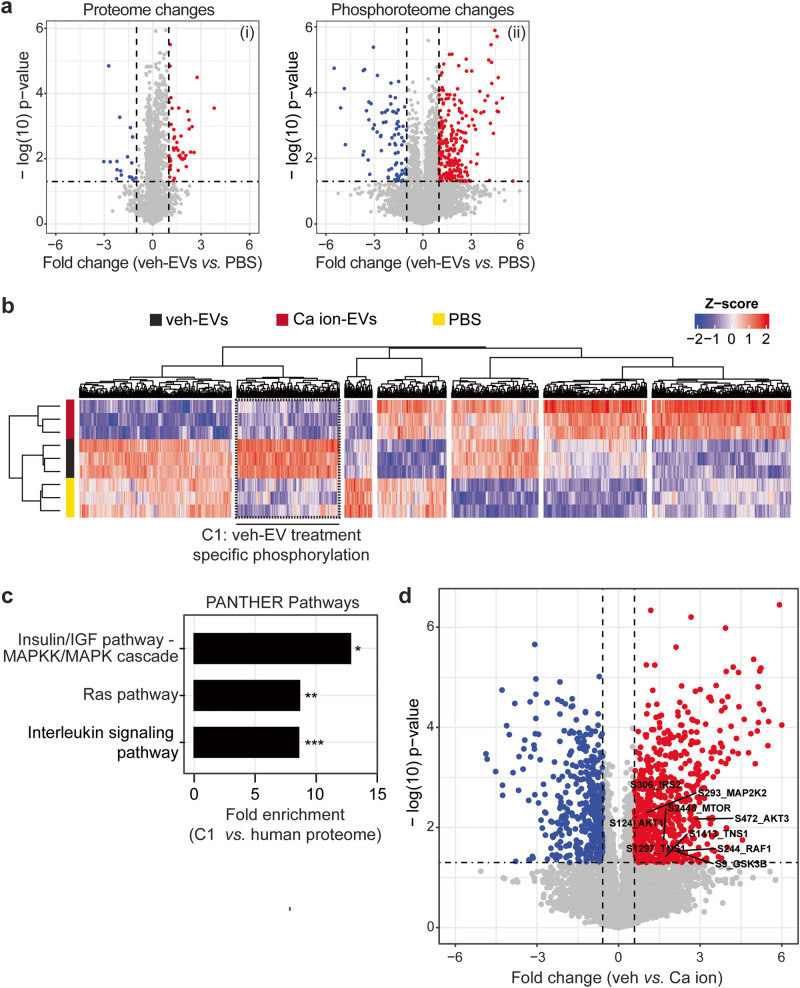
Fig. 3. Phosphoproteomic analysis of HMEC-1 upon veh-EV- and Ca ion-EV stimulation.
a Volcano plots showing changes in the (i) proteome and (ii) phosphoproteome of HMEC-1 after veh-EV stimulation compared to negative control (PBS). P-values were calculated using student’s T-test, and significantly changing proteins (p-value ≤ 0.05 and fold change >2) in veh-EV-treated HMEC-1 are highlighted in red, while significantly changing proteins in PBS are highlighted in blue. b Hierarchical clustering of 1549 significantly changing phosphosites (ANOVA, q-value ≤ 0.05) found in HMEC-1 upon stimulation with veh-EVs, Ca ion-EVs and PBS. Cluster C1, including veh-EV-induced specific phosphorylation, is highlighted with dashed lines. c PANTHER Pathway enrichment analysis of phosphoproteins found in clusters C1, ranked on fold enrichment. *= FDR < 0.05, **= FDR < 0.01, ***= FDR < 0.005. d Volcano plot showing fold changes in the phosphoproteome of HMEC-1 upon veh-EV compared with Ca ion-EV stimulation, also represented in Fig. 6a. P-values were calculated using student’s T-test, and significantly changing phosphosites (p-value < 0.05 and fold change >2) after veh-EV treatment are highlighted in red, while significantly changing phosphosites after Ca ion-EV treatment are highlighted in blue.

