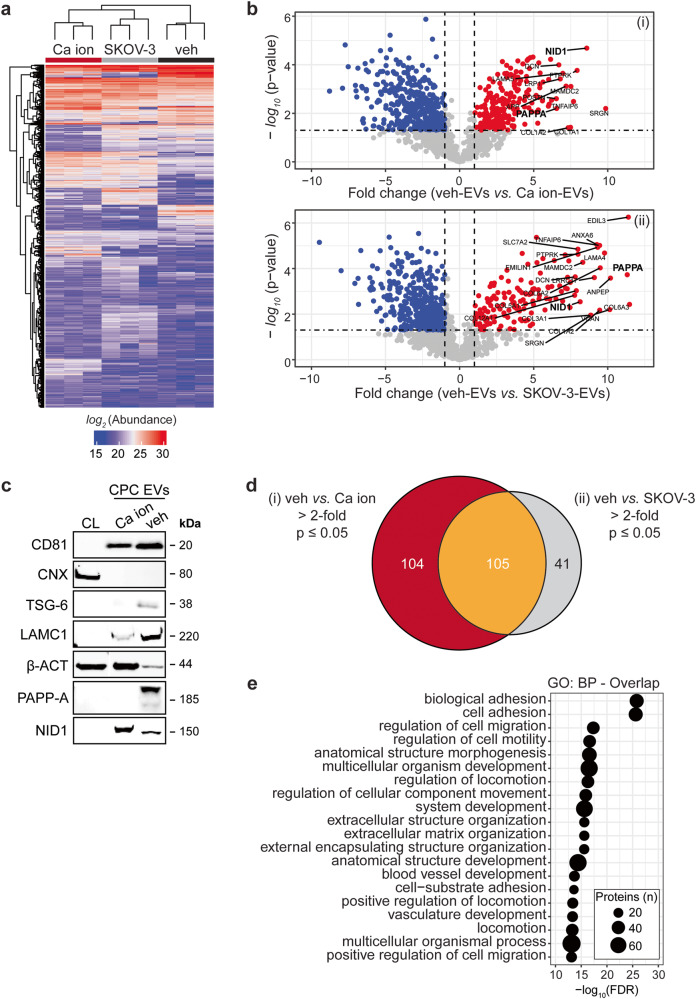
Fig. 5. LC–MS/MS identified enriched proteins in veh-EVs compared with Ca ion- and SKOV-3-EVs.
a Heat map of protein abundance (log2) of proteins identified in each biological replicate (veh-, Ca ion- and SKOV-3-EVs), as identified by LC–MS/MS. b Volcano plots showing average fold changes for protein abundance (log2) of proteins identified in veh-EVs compared to (i) Ca ion-EVs and (ii) SKOV-3-EVs. P-values were calculated using student’s T-test, and significantly changing proteins (p-value ≤ 0.05 and fold change >2) in veh-EVs are highlighted in red, while significantly changing proteins in Ca ion- and SKOV-3-EVs are highlighted in blue. c Western blot analysis confirming the enrichment of MS-identified proteins NID1, TSG-6, LAMC1, PAPP-A, CD81 and β-actin (β-ACT) in veh-EVs compared with Ca ion-EVs. CNX was solely present in CPC lysate (CL). Complete blots of β-ACT, PAPP-A and NID1 are displayed in Supplementary Fig. 10. d Venn diagram showing number of proteins with >2-fold significant enrichment (p ≤ 0.05) in veh-EVs compared to Ca ion- and SKOV-3-EVs, and overlap between those two populations. e Gene ontology analysis using PANTHER of enriched biological processes for the 105 overlapping proteins, depicting number of identified proteins in each group, ranked on smallest corrected p-value (−log10(FDR)).

