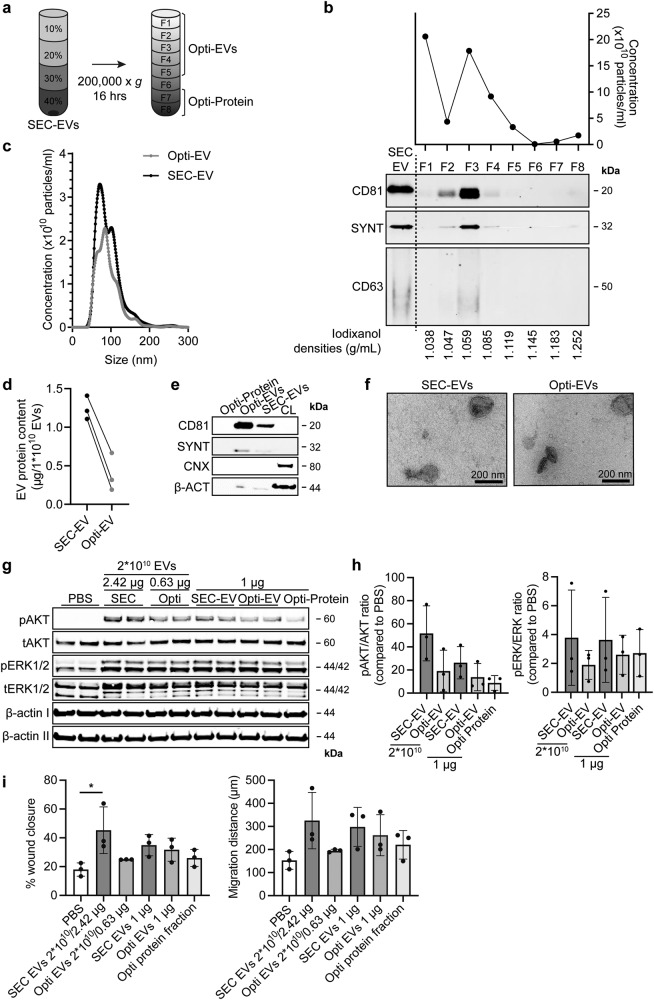
Fig. 8. Both co-isolated proteins and EV-associated factors contribute to HMEC-1 activation.
a Schematic overview of the EV isolation protocol to obtain pure Opti-EVs. SEC-EVs were loaded in the bottom of a discontinuous OptiprepTM gradient and ultracentrifuged for 16 h. b Resulting fractions (F1–8) were analysed for particle number by NTA (upper panel) and the presence of EV-marker proteins CD81, CD63 and Syntenin-1 (SYNT) by western blotting. Equal volumes of each sample were analysed. Iodixanol concentration was measured in each fraction (lower panel). Fractions 1–5 were pooled and concentrated (Opti-EVs). c Representative NTA plot showing the size distribution and particle concentration of SEC- and purified Opti-EVs. d Protein content per 1 × 10¹⁰ SEC- and Opti-EVs of three representative experiments. e Western blot analysis showing presence of CD81, SYNT, β-actin (β-ACT) in purified Opti-EV- and protein fractions, compared with crude SEC-EVs. Calnexin (CNX) was only present in CPC lysate (CL). Complete β-ACT blot is displayed in Supplementary Fig. 10. f Representative TEM image of SEC- and Opti-EVs. g, h Representative western blot analysis of phosphorylated AKT (pAKT), total AKT (tAKT), phosphorylated ERK1/2 (pERK1/2) and total ERK1/2 (tERK1/2) in HMEC-1 treated with SEC-EVs and Opti-EVs normalized on total particle numbers, and with SEC-EVs, Opti-EVs and Opti-protein fraction normalized on total protein content. β-ACT was included as housekeeping protein (I = phosphorylated protein blot, II = total protein blot). h Quantification of pAKT, tAKT, pERK1/2 and tERK1/2 expression levels using densitometry expressed as pAKT/AKT and pERK/ERK ratios (n = 3). Biological replicates of (g) are displayed in Supplementary Fig. 9e, f. i Wound healing experiment showing effects SEC- and Opti-EVs on HMEC-1 migration normalized both on total particle number and total protein content, analysed both as % wound closure and absolute migration distance. Addition of Opti-protein fraction was normalized on volume (n = 3, technical replicates. Data are representative of three biologically independent experiments). Data are presented as mean ± SD. *p < 0.033.

