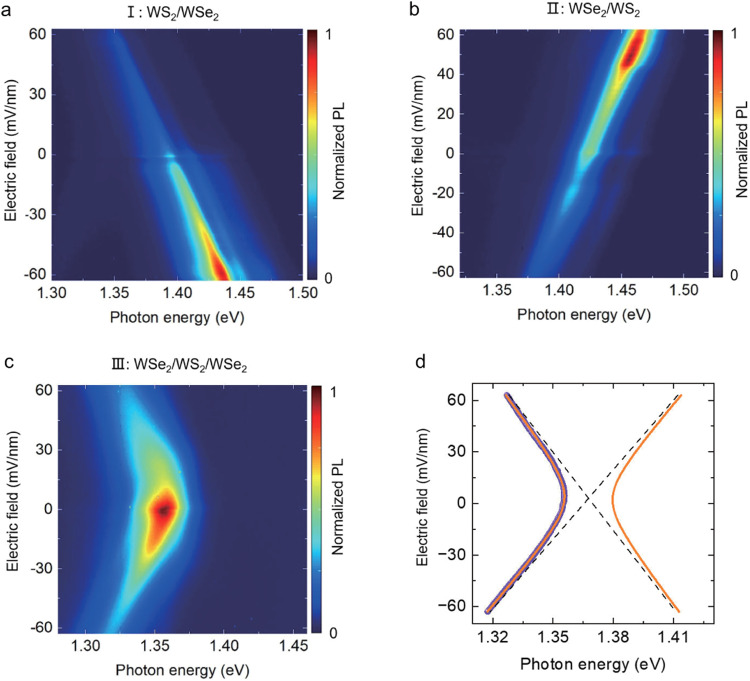
Fig. 2. Electric field-dependent PL spectra of dipolar and quadrupolar excitons.
a–c are electric field-dependent PL spectra of the region I, II, and III, respectively. d Fitting of the quadrupolar excitons PL resonances (orange curve) on extracted PL peak energy (purple spheres) as a function of the electric field from (c). The PL peak positions are extracted by fitting each PL spectrum with a single Lorentzian peak. The PL data were taken from device D5.

