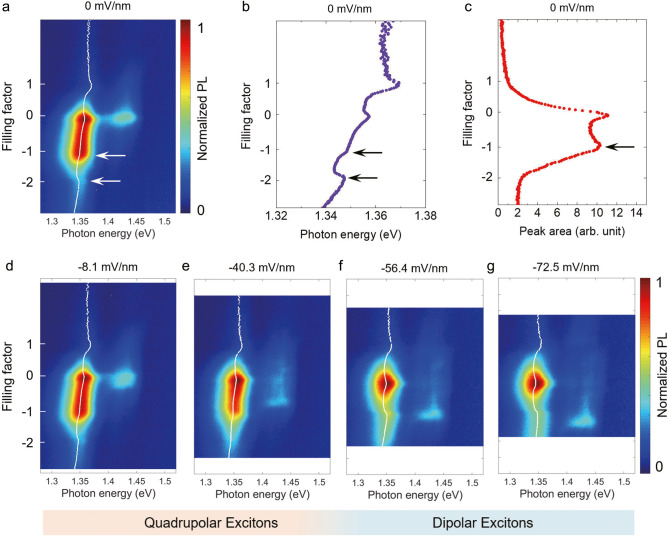
Fig. 3. Evolution of doping-dependent PL spectra of the trilayer region at different electric fields.
a) the PL spectra as a function of the filling factor at the zero electric field. b PL peak energy and c integrated PL intensity, extracted from (a), plotted as a function of the filling factor. d–g are doping-dependent PL spectra at several external electric fields increasing in the negative direction. d, e are in the quadrupolar exciton regime, while f, g are transitioned to the dipolar exciton regime. The dotted white lines in the color plots are the extracted PL peak energies through fitting (details in Supplementary Information Section 8). The PL data were taken from device D1.

