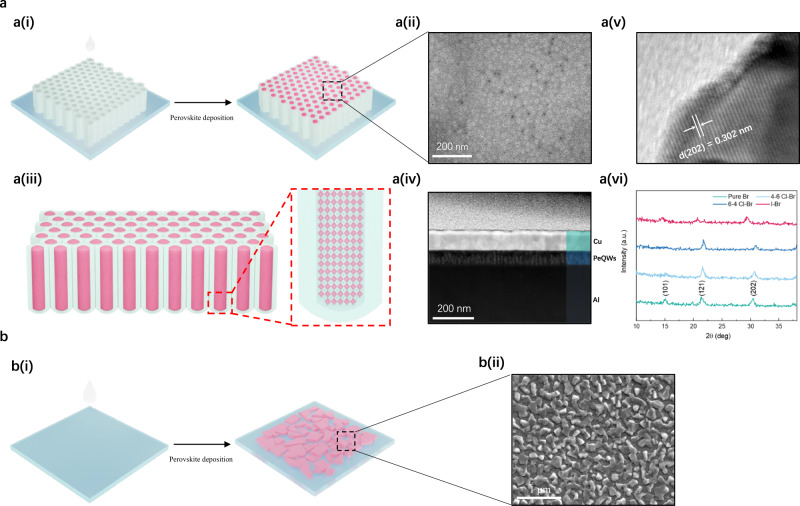
Fig. 1. Deposition and formation of PeQW arrays.
a (i) Schematic illustrations of the perovskite deposition process on PAM template. (ii) Top view SEM images of the PeQWs. (iii) Schematic drawing of cross-sectional view of perovskite QWs arrays. (iv) The cross-sectional TEM image of PeQW arrays. (v) HRTEM image of CsPbBr3 QW extracted from PAM template. (vi) XRD patterns of the four different PeQW arrays in PAM. b (i) Schematic illustrations of the perovskite deposition process on ITO glass. (ii) Top view SEM images of the thin film.

