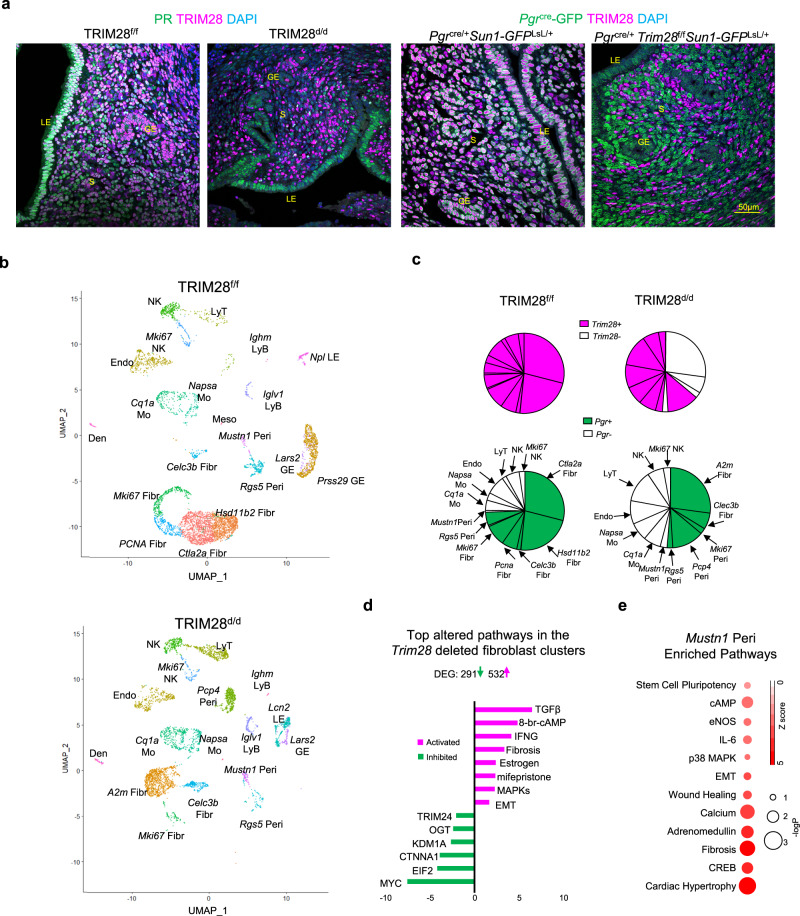
Fig. 7. Abnormally accumulation of TRIM28 positive alone cells in the TRIM28d/d uterus.
a Immunofluorescence (IF) of TRIM28 and PR in the TRIM28f/f and TRIM28d/d mice at D3.5. Immunofluorescence of TRIM28 and Pgrcre-GFP in the Pgrcre/+Sun1-GFPLsL/+ and Pgrcre/+Trim28f/f Sun1-GFPLsL/+ mice at D3.5. b UMAP of scRNA-Seq in the TRIM28f/f and TRIM28d/d mice at D3.5. c The pie plot of all the non-epithelial clusters. Each sector represented one cell cluster. The area of the sector is proportional to the number of the cells in each cluster. The TRIM28+ is magenta. The PGR+ is green. d The top altered pathways in the A2m Fibr from the TRIM28d/d mice compared with the Hsd11b2 Fibr from the TRIM28f/f mice. Green means inhibition. Magenta means activation. e Enriched pathway in Mustn1 Peri annotated by IPA based on the cluster specific marker genes. The size of the red dot is proportional to the -logP value. The red color is proportional to the z score. Fibr Fibroblast, Peri Pericytes, LE Luminal epithelium, GE Glandular epithelium, Endo Endothelium, Mo Myeloid, NK Natural killer cells, LyT Lymphocyte T, LyB Lymphocyte, Den Dendritics, Meso Mesothelium. The IF was repeated in three different mice per group with similar results.

