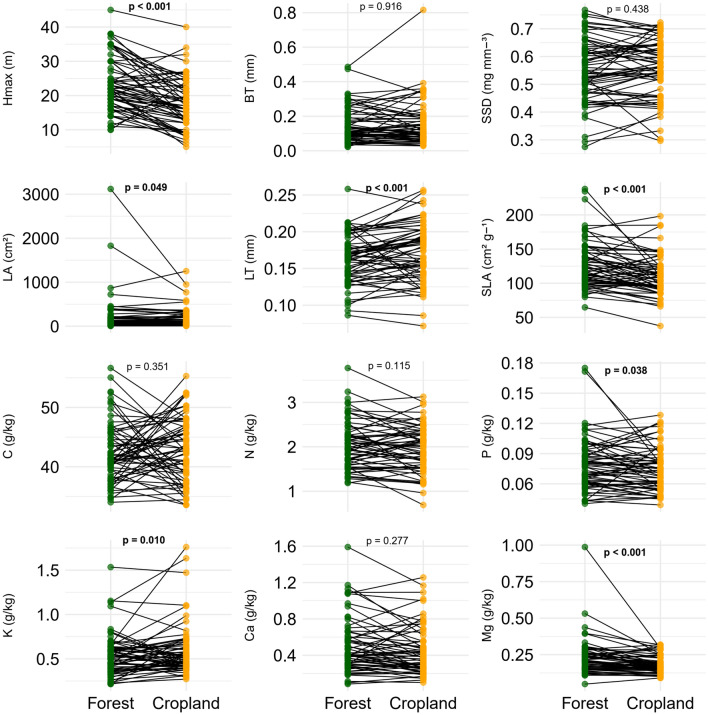
Figure 3.
Comparisons of mean values of functional traits of riparian tree species shared between riparian forests in forested (Forest) and cropland (Cropland) catchments in southern Amazonia, Querência–MT, Brazil. Points indicate individual species, with lines connecting trait values for a species found in cropland vs. forested catchments. Hmax = maximum tree height; BT = bark thickness; SSD = stem-specific density; LA = leaf area; LT = leaf thickness, SLA = specific leaf area, C = leaf carbon concentration, N = leaf nitrogen concentration, K = leaf potassium concentration, P = leaf phosphorus concentration, Ca = leaf calcium concentration, and Mg = leaf magnesium concentration. A 5% significance level was used for this analysis (n = 64).

