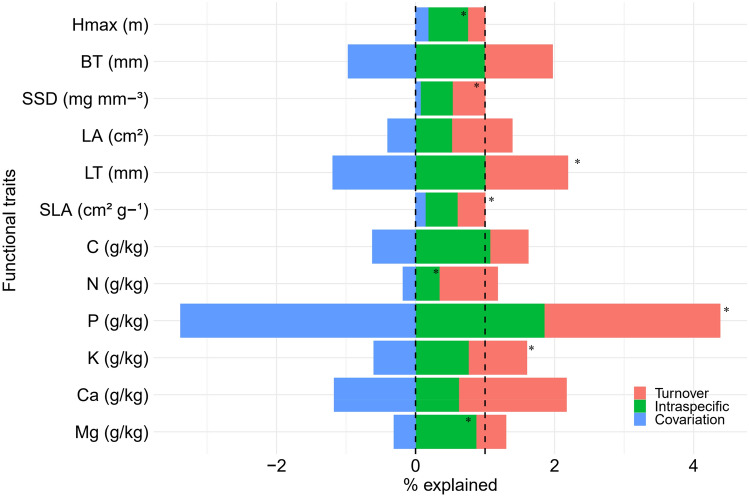
Figure 5.
Effect of turnover on tree species composition, intraspecific trait variability, and their covariation between riparian forests in forested (Forest) and cropland (Cropland) catchments in southern Amazonia, Querência–MT, Brazil. Hmax = maximum tree height; BT = bark thickness; SSD = stem-specific density; LA = leaf area; LT = leaf thickness, SLA = specific leaf area, C = leaf carbon concentration, N = leaf nitrogen concentration, K = leaf potassium concentration, P = leaf phosphorus concentration, Ca = leaf calcium concentration, and Mg = leaf magnesium concentration. Line dashed = Total—specific average [0 to 1]; * = Differed significantly at 5% (Table S5).

